analitics

Pages

Monday, September 21, 2020

Python 3.8.5 : A sphere in Cartesian coordinates - part 001.

I like the equation of a sphere of radius R centered at the origin is given in Cartesian coordinates:

x*x + y*y + z*z = r*r

It is one of the first elements that helped me better understand mathematics and later the dynamics and theory of electromagnetic fields.

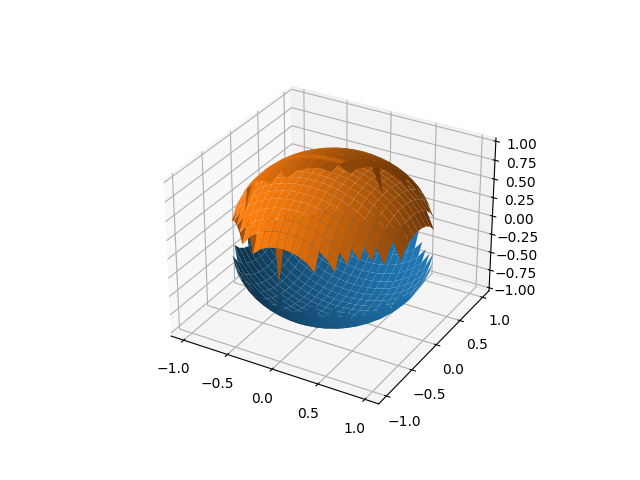
I did not find a graphical representation using python as accurately as possible without eliminating the discretion of the range from -1 and 1 and radius * radius = 1.

The main reason is the plot_surface from matplotlib python package.

This is output of my script:

[mythcat@desk ~]$ python sphere_xyz.py 
[-1.         -0.91666667 -0.83333333 -0.75       -0.66666667 -0.58333333
 -0.5        -0.41666667 -0.33333333 -0.25       -0.16666667 -0.08333333
  0.          0.08333333  0.16666667  0.25        0.33333333  0.41666667
  0.5         0.58333333  0.66666667  0.75        0.83333333  0.91666667
  1.        ]
sphere_xyz.py:7: RuntimeWarning: invalid value encountered in sqrt
  return np.sqrt(1-x**2 - y**2)
sphere_xyz.py:18: UserWarning: Z contains NaN values. This may result in rendering artifacts.
  surface1 = ax.plot_surface(X2, Y2, -Z2,rstride=1, cstride=1, linewidth=0,antialiased=True)
sphere_xyz.py:19: UserWarning: Z contains NaN values. This may result in rendering artifacts.
  surface2 = ax.plot_surface(X2, Y2, Z2,rstride=1, cstride=1, linewidth=0,antialiased=True)

The image result is this:

The source code is this:

import matplotlib.pyplot as plt
import numpy as np
from matplotlib.colors import LightSource

#@np.vectorize
def solve_Z2(x,y):
    return np.sqrt(1-x**2 - y**2)

fig = plt.figure()
ax = fig.gca(projection='3d')

xrange2 = np.linspace(-1.0, 1.0, 25)
yrange2 = np.linspace(-1.0, 1.0, 25)
print(xrange2)
X2, Y2 = np.meshgrid(xrange2, yrange2)
Z2 = solve_Z2(X2, Y2)

surface1 = ax.plot_surface(X2, Y2, -Z2,rstride=1, cstride=1, linewidth=0,antialiased=True)
surface2 = ax.plot_surface(X2, Y2, Z2,rstride=1, cstride=1, linewidth=0,antialiased=True)

plt.show()

Saturday, September 19, 2020

Python 3.8.5 : Linked List - part 001.

In computer science, a linked list is a linear collection of data elements whose order is not given by their physical placement in memory. see wikipedia.org.

In this tutorial I will show you how these linked list works and how can build with python programming language.
Let's start with some basic elements:
  • Linked List is a linear data structure;
  • Linked List are not array;
  • Linked List are not stored at a contiguous location because use pointes;
  • Each element use a linked pointe;
  • Linked List has a dynamic size;
  • Linked List use operations like insertion and deletion for each element;
  • The access to elements is sequentially;
  • Using reference to pointer foe each element needs extra memory space and is not cache friendly;

The Linked List consists of at least two parts: data and pointer to the next node.
The first element of the list is called the head.

The last node has a reference to null.
The each element named node of the list has a similar structure like Linked List: data node and pointer to the next node.
The data from Linked list is represent like a sequence.

A number of operations are required to use the Linked List.

The basic operations supported by a list can be:

  • insertion - adds an element at the beginning of the list;
  • deletion - deletes an element at the beginning of the list;
  • display - displays the complete list;
  • search - searches an element using the given key;
  • delete - deletes an element using the given key.

The Advantages of Linked List elements can be easily inserted or removed without reallocation or reorganization of the entire structure because the data items need not be stored contiguously in memory or on disk using operations.

The Linked List structure allows several ways to link nodes resulting in a number of types of Linked List:
  • Simple linked list;
  • Doubly linked list;
  • Multiply linked list;
  • Circular linked list;
  • Sentinel nodes;
  • Empty lists;
  • Hash linking;
  • List handles;
  • Combining alternatives;

Let's start with first source code for the first type of Linked List named Simple linked list.

Python 3.8.5 (default, Aug 12 2020, 00:00:00) 
[GCC 10.2.1 20200723 (Red Hat 10.2.1-1)] on linux
Type "help", "copyright", "credits" or "license" for more information.
>>> # create a node class 
>>> class Node:
...     # first initialise of the node object
...     def __init__(self, data):
...             # assign the node data 
...             self.data = data
...             # initialize next element as null
...             self.next = None
... 
>>> # create a simple linked list
>>> class Simple_LinkedList:
...     # first initialize of element named head
...     def __init__(self):
...             self.head = None
>>> # use the list 
>>> if __name__=='__main__': 
...     simple_list = Simple_LinkedList()
...     simple_list.head = Node(1)
...     second = Node(2)
...     third = Node(3)
...     #link first node with the second
...     simple_list.head.next = second
...     #link second  node with the third
...     second.next = third
...     # now the list is linked as a simple Linked List

This source code don't include any basic operations.

If you put this source code into python script and run it you will see this:

[mythcat@desk ~]$ python simple_LinkedList.py 
<__main__.Node object at 0x7f35163e1ac0>
<__main__.Node object at 0x7f351638b0a0>
<__main__.Node object at 0x7f351638b130>

I create a basic operation for this simple Linked List to display the content of this list:

# create a simple linked list with a basic diplay operation
class Simple_LinkedList:
    # first initialize of element named head
    def __init__(self):
            self.head = None
    # use the basic operation for display
    def display_Simple_LinkedList(self): 
        points_to_node = self.head
	#will traverse the list to the last node. 
        while (points_to_node): 
            # print data linked to points_to_node
            print (points_to_node.data) 
            # print next node linked to points_to_node
            points_to_node = points_to_node.next

I run with this new python source code and result is this:

[mythcat@desk ~]$ python simple_LinkedList_basic_display.py 
1
2
3 

Thursday, September 10, 2020

Python 3.8.5 : Get Sentinel-3 satellite data from Eutelsat.

The tutorial for today is about Eutelsat satellites.
I used Sentinel-3 with these features:
  • Instrument: SLSTR;
  • Mode: EO;
  • Satellite: Sentinel-3

You need to install xarray and netcdf4 python packages:
[mythcat@desk TLauncher]$ pip install xarray
...
[mythcat@desk ~]$ pip install netcdf4

Defaulting to user installation because normal site-packages is not writeable
Collecting netcdf4
  Downloading netCDF4-1.5.4-cp38-cp38-manylinux1_x86_64.whl (4.3 MB)
     |████████████████████████████████| 4.3 MB 649 kB/s 
Collecting cftime
  Downloading cftime-1.2.1-cp38-cp38-manylinux1_x86_64.whl (271 kB)
     |████████████████████████████████| 271 kB 30.5 MB/s 
Requirement already satisfied: numpy>=1.9 in /usr/lib64/python3.8/site-packages (from netcdf4) (1.18.4)
Installing collected packages: cftime, netcdf4
Successfully installed cftime-1.2.1 netcdf4-1.5.4 
You need to get data from the official webpage.

After I download the nc file with all data I used this source code:
Python 3.8.5 (default, Aug 12 2020, 00:00:00) 
[GCC 10.2.1 20200723 (Red Hat 10.2.1-1)] on linux
Type "help", "copyright", "credits" or "license" for more information.
>>> import xarray as xr
>>> dir = '/home/mythcat/Downloads/'
>>> file_xr = xr.open_dataset(dir+'FRP_in.nc')
>>> file_xr
<xarray .dataset="">
Dimensions:                 (columns: 1500, fires: 23, rows: 2000)
Dimensions without coordinates: columns, fires, rows
Data variables:
    i                       (fires) int16 ...
    j                       (fires) int32 ...
    time                    (fires) datetime64[ns] ...
    latitude                (fires) float64 ...
    longitude               (fires) float64 ...
    FRP_MWIR                (fires) float64 ...
    FRP_uncertainty_MWIR    (fires) float64 ...
    transmittance_MWIR      (fires) float64 ...
    FRP_SWIR                (fires) float64 ...
    FRP_uncertainty_SWIR    (fires) float64 ...
    FLAG_SWIR_SAA           (fires) int16 ...
    transmittance_SWIR      (fires) float64 ...
    confidence              (fires) float64 ...
    classification          (fires) uint8 ...
    S7_Fire_pixel_radiance  (fires) float32 ...
    F1_Fire_pixel_radiance  (fires) float32 ...
    used_channel            (fires) uint8 ...
    Radiance_window         (fires) float32 ...
    Glint_angle             (fires) float64 ...
    IFOV_area               (fires) float64 ...
    TCWV                    (fires) float64 ...
    n_window                (fires) int16 ...
    n_water                 (fires) int16 ...
    n_cloud                 (fires) int16 ...
    n_SWIR_fire             (fires) float32 ...
    flags                   (rows, columns) uint32 ...
Attributes:
    title:                  SLSTR Level 2 Product, Fire Radiative Power measu...
    comment:                 
    netCDF_version:         4.2 of Jul  5 2012 17:07:43 $
    product_name:           S3B_SL_2_FRP____20200910T082906_20200910T083406_2...
    institution:            MAR
    source:                 IPF-SL-2-FRP 02.00
    history:                 
    references:             S3MPC ACR FRP 003 - i1r2 - SLSTR L2 Product Data ...
    contact:                ops@eumetsat.int
    creation_time:          2020-09-10T10:38:54Z
    resolution:             [ 1000 1000 ]
    absolute_orbit_number:  12385
    start_time:             2020-09-10T08:29:06.288252Z
    stop_time:              2020-09-10T08:34:06.277355Z
    track_offset:           998
    start_offset:           14032
Let's parse size by latitude and longitude:
>>> lat = file_xr['latitude']
>>> long = file_xr['longitude']
>>> lat , long 
(<xarray.DataArray 'latitude' (fires: 23)>
array([52.992509, 52.98967 , 48.447335, 44.00415 , 48.443263, 48.439204,
       48.438141, 48.434069, 48.430012, 48.430012, 43.99905 , 43.993966,
       43.996166, 43.991064, 43.991064, 43.985972, 43.986568, 43.981467,
       43.976379, 43.978613, 43.973495, 43.973495, 43.968419])
Dimensions without coordinates: fires
Attributes:
    long_name:      Latitude
    standard_name:  latitude
    units:          degrees_north
    valid_min:      -90.0
    valid_max:      90.0, 
array([38.424813, 38.441404, 29.594317, 26.774829, 29.607258, 29.620235,
       29.592402, 29.605285, 29.618236, 29.618236, 26.787083, 26.799272,
       26.77044 , 26.782656, 26.782656, 26.7949  , 26.769496, 26.781764,
       26.794036, 26.765122, 26.777358, 26.777358, 26.789596])
Dimensions without coordinates: fires
Attributes:
    long_name:      Longitude
    standard_name:  longitude
    units:          degrees_east
    valid_min:      -180.0
    valid_max:      180.0) 
Get FRP_SWIR and FRP_MWIR data from satelite:
>>> FRP_SWIR = file_xr['FRP_SWIR']
>>> FRP_SWIR 

array([-1., -1., -1., -1., -1., -1., -1., -1., -1., -1., -1., -1., -1., -1.,
       -1., -1., -1., -1., -1., -1., -1., -1., -1.])
Dimensions without coordinates: fires
Attributes:
    long_name:  Fire radiative power computed from SWIR channel (S6)
    units:      MW 
>>> FRP_MWIR = file_xr['FRP_MWIR']
>>> FRP_MWIR

array([ 10.290943,  11.447042, 179.555982,  84.84376 ,  48.277547,   9.320155,
        17.840467,  38.242334,  18.615514,  18.611452,  14.36118 ,   4.440371,
         3.06999 ,   5.008403,   5.005609,   4.452938,   8.228399,   8.442025,
         5.631591,   3.531036,   3.509205,   3.507225,   2.876292])
Dimensions without coordinates: fires
Attributes:
    long_name:  Fire radiative power computed from MWIR channels (S7 and F1)
    units:      MW 

Sunday, August 30, 2020

Python 3.8.5 : Testing with openpyxl - part 002 .

Today I will show you how can use Levenshtein ratio and distance between two strings, see wikipedia.
I used three files created with LibreOffice and save it like xlsx file type.
All of these files come with the column A fill with strings of characters, in this case, numbers.
The script will read all of these files from the folder named xlsx_files and will calculate Levenshtein ratio and distance between the strings of name of these files and column A.
Finally, the result is shown into a graph with matplotlib python package.
Let's see the python script:
import os
from glob import glob

from openpyxl import load_workbook
import numpy as np 
import matplotlib.pyplot as plt 

def levenshtein_ratio_and_distance(s, t, ratio_calc = False):
    """ levenshtein_ratio_and_distance - distance between two strings.
        If ratio_calc = True, the function computes the
        levenshtein distance ratio of similarity between two strings
        For all i and j, distance[i,j] will contain the Levenshtein
        distance between the first i characters of s and the
        first j characters of t
    """
    # Initialize matrix of zeros
    rows = len(s)+1
    cols = len(t)+1
    distance = np.zeros((rows,cols),dtype = int)

    # Populate matrix of zeros with the indeces of each character of both strings
    for i in range(1, rows):
        for k in range(1,cols):
            distance[i][0] = i
            distance[0][k] = k
    for col in range(1, cols):
        for row in range(1, rows):
            # check the characters are the same in the two strings in a given position [i,j] 
            # then the cost is 0
            if s[row-1] == t[col-1]:
                cost = 0 
            else:             
                # calculate distance, then the cost of a substitution is 1.
                if ratio_calc == True:
                    cost = 2
                else:
                    cost = 1
            distance[row][col] = min(distance[row-1][col] + 1,      # Cost of deletions
                                 distance[row][col-1] + 1,          # Cost of insertions
                                 distance[row-1][col-1] + cost)     # Cost of substitutions
    if ratio_calc == True:
        # Ration computation of the Levenshtein Distance Ratio
        Ratio = ((len(s)+len(t)) - distance[row][col]) / (len(s)+len(t))
        return Ratio
    else:
        return distance[row][col]


PATH = "/home/mythcat/xlsx_files/"
result = [y for x in os.walk(PATH) for y in glob(os.path.join(x[0], '*.xlsx'))]
result_files = [os.path.join(path, name) for path, subdirs, files in os.walk(PATH) for name in files]
#print(result)
row_0 = []

for r in result:
    n = 0
    wb = load_workbook(r)
    sheets = wb.sheetnames
    ws = wb[sheets[n]]
    for row in ws.rows:
            if (row[0].value) != None :
                rows = row[0].value
                row_0.append(rows)

print("All rows of column A ")
print(row_0)
files = []
for f in result_files:
    ff = str(f).split('/')[-1:][0]
    fff = str(ff).split('.xlsx')[0]
    files.append(fff)

print(files)
# define tree lists for levenshtein
list1 = []
list2 = []

for l in row_0:
    str(l).lower()
    for d in files:
        Distance = levenshtein_ratio_and_distance(str(l).lower(),str(d).lower())   
        Ratio = levenshtein_ratio_and_distance(str(l).lower(),str(d).lower(),ratio_calc = True)
        list1.append(Distance)
        list2.append(Ratio)
        
print(list1, list2)
# plotting the points  
plt.plot(list1,'g*', list2, 'ro' )
plt.show()
The result is this:
[mythcat@desk ~]$ python test_xlsx.py
All rows of column A 
[11, 2, 113, 4, 1111, 4, 4, 111, 2, 1111, 5, 4, 4, 3, 1111, 1, 2, 1113, 4, 115, 1, 2, 221, 1, 1,
 43536, 2, 34242, 3, 1]
['001', '002', '003']
[2, 3, 3, 3, 2, 3, 3, 3, 2, 3, 3, 3, 3, 4, 4, 3, 3, 3, 3, 3, 3, 2, 3, 3, 3, 2, 3, 3, 4, 4, 3, 3, 
3, 3, 3, 3, 3, 3, 3, 3, 3, 2, 3, 4, 4, 2, 3, 3, 3, 2, 3, 3, 4, 3, 3, 3, 3, 3, 3, 3, 2, 3, 3, 3, 
2, 3, 2, 3, 3, 2, 3, 3, 2, 3, 3, 5, 5, 4, 3, 2, 3, 5, 4, 5, 3, 3, 2, 2, 3, 3] [0.4, 0.0, 0.0, 0.0, 
0.5, 0.0, 0.3333333333333333, 0.0, 0.3333333333333333, 0.0, 0.0, 0.0, 0.2857142857142857, 0.0, 0.0,
 0.0, 0.0, 0.0, 0.0, 0.0, 0.0, 0.3333333333333333, 0.0, 0.0, 0.0, 0.5, 0.0, 0.2857142857142857, 0.0,
 0.0, 0.0, 0.0, 0.0, 0.0, 0.0, 0.0, 0.0, 0.0, 0.0, 0.0, 0.0, 0.5, 0.2857142857142857, 0.0, 0.0, 0.5,
 0.0, 0.0, 0.0, 0.5, 0.0, 0.2857142857142857, 0.0, 0.2857142857142857, 0.0, 0.0, 0.0, 0.3333333333333333,
 0.0, 0.0, 0.5, 0.0, 0.0, 0.0, 0.5, 0.0, 0.3333333333333333, 0.3333333333333333, 0.0, 0.5, 0.0, 0.0,
 0.5, 0.0, 0.0, 0.0, 0.0, 0.25, 0.0, 0.5, 0.0, 0.0, 0.25, 0.25, 0.0, 0.0, 0.5, 0.5, 0.0, 0.0]
Monday, August 24, 2020

Python Qt5 : Get item data from QTreeWidgets.

In this example, I create a tree view with QTreeView with all folders tree.
I add a context_menu with two options.
One option is to get the data from item and is the name of the folder.
The second option is to close the application.
Let's see the source code:
import sys
from PyQt5.QtWidgets import QApplication, QFileSystemModel, QDesktopWidget
from PyQt5.QtWidgets import QTreeView, QWidget, QVBoxLayout, QMenu
from PyQt5.QtGui import QIcon
from PyQt5 import QtCore
from PyQt5.QtCore import Qt, QObject

class my_app_tree(QWidget):

    def __init__(self):
        super().__init__()
        self.title = "show files and folders on tree view"
        #self.left = 0
        #self.top = 0
        #self.width = 640
        #self.height = 480
        self.center()
        self.resize(640,480)
        self.initUI()

    def center(self):
        frame_geometry = self.frameGeometry()
        center_position = QDesktopWidget().availableGeometry().center()
        frame_geometry.moveCenter(center_position)
        self.move(frame_geometry.topLeft())

    def context_menu(self, position):
        menu = QMenu()
        copy_action = menu.addAction("Get folder")
        quit_action = menu.addAction("Quit")
        action = menu.exec_(self.tree.mapToGlobal(position))
        # quit application
        if action == quit_action:
            my_application.quit()
        # copy folder name from item
        elif action == copy_action:
            item = self.tree.selectedIndexes()[0].data()
            print("name folder is: "+str(item))

    def initUI(self):
        self.setWindowTitle(self.title)
        #the next source code line is used with left, top, width, height from __init__
        #self.setGeometry(self.left, self.top, self.width, self.height)
        
        self.model = QFileSystemModel()
        self.model.setRootPath('')
        self.tree = QTreeView()
        self.tree.setModel(self.model)
        
        self.tree.setAnimated(False)
        self.tree.setIndentation(20)
        self.tree.setSortingEnabled(True)
        
        self.tree.setWindowTitle("Dir View")
        self.tree.resize(640, 480)
        
        windowLayout = QVBoxLayout()
        windowLayout.addWidget(self.tree)
        self.setLayout(windowLayout)

        self.tree.setContextMenuPolicy(Qt.CustomContextMenu)
        self.tree.customContextMenuRequested.connect(self.context_menu)
        
        self.show()

if __name__ == '__main__':
    my_application = QApplication(sys.argv)
    example = my_app_tree()
    sys.exit(my_application.exec_())
The result of this source code can be see in the next image:

Sunday, August 23, 2020

Python Qt5 : Add and remove items between two QTreeWidgets.

Today's tutorial will show you how to add and remove items between two QTreeWidgets.
The source code is very simple to understand: the user interface is created with two QTreeWidgets.
One is completed with elements and when the buttons are pressed, the elements are interchanged.
import sys
from PyQt5.QtWidgets import QApplication, QWidget, QDesktopWidget, QPushButton
from PyQt5.QtWidgets import QBoxLayout,QTreeWidget,QTreeWidgetItem

class my_app_class(QWidget):
    def __init__(self):
        super().__init__()

        self.add_button=QPushButton('Add item here')
        self.remove_button=QPushButton('Remove item')
        self.wishlist=QTreeWidget(self)
        self.tree_list=QTreeWidget(self)
        # init the UI
        self.initUI()

    def initUI(self):
        # set title of window
        self.setWindowTitle('add and remove items from QTreeWidget!')

        self.init_tree()

        self.resize(800, 480)
        self.center()
        self.show()

    def center(self):
        geometry_frame = self.frameGeometry()
        center_pos = QDesktopWidget().availableGeometry().center()
        geometry_frame.moveCenter(center_pos)
        self.move(geometry_frame.topLeft())


    def init_tree(self):
        headers = ['A','B','C','D']

        self.tree_list.setColumnCount(len(headers))
        self.tree_list.setHeaderLabels(headers)

        self.wishlist.setColumnCount(len(headers))
        self.wishlist.setHeaderLabels(headers)


        list_layout = QBoxLayout(QBoxLayout.LeftToRight)
        list_layout.addWidget(self.tree_list)
        list_layout.addWidget(self.wishlist)

        tree_root = QTreeWidget.invisibleRootItem(self.tree_list)
        # add data to QTreeWidget with QTreeWidgetItem
        my_data = ['1','2','3','4']
        item = QTreeWidgetItem()
        for idx, data in enumerate(my_data):
            item.setText(idx, data)

        tree_root.addChild(item)

        my_data = ['11','10','01','D']
        item = QTreeWidgetItem()
        for idx, data in enumerate(my_data):
            item.setText(idx, data)

        tree_root.addChild(item)

        my_data = ['s', 'c', 'c', 'c']
        item = QTreeWidgetItem()
        for idx, data in enumerate(my_data):
            item.setText(idx, data)

        tree_root.addChild(item)

        btn_layout = QBoxLayout(QBoxLayout.RightToLeft)
        btn_layout.addWidget(self.add_button)
        btn_layout.addWidget(self.remove_button)

        main_layout = QBoxLayout(QBoxLayout.TopToBottom)
        main_layout.addLayout(list_layout)
        main_layout.addLayout(btn_layout)

        self.add_button.clicked.connect(self.move_item)
        self.remove_button.clicked.connect(self.move_item)

        self.setLayout(main_layout)
        return main_layout


    def move_item(self):
        sender = self.sender()

        if self.add_button == sender:
            source = self.tree_list
            target = self.wishlist
        else:
            source = self.wishlist
            target = self.tree_list

        item = QTreeWidget.invisibleRootItem(source).takeChild(source.currentIndex().row())
        QTreeWidget.invisibleRootItem(target).addChild(item)

if __name__=='__main__':
    # start the QApplication
    my_application = QApplication(sys.argv)
    # create aplication with the class
    example = my_app_class()
    # use exit for QApplication
    sys.exit(my_application.exec_())