analitics

Pages

Showing posts with label streamlit. Show all posts

Monday, December 12, 2022

Python 3.10.2 : Quickstart with streamlit python package.

In today's tutorial, I will give you a brief introduction to the streamlit packet.
Streamlit turns data scripts into shareable web apps in minutes. All in pure Python. No front‑end experience required.
Let's install with the pip tool:
pip install streamlit
After installation, I tested their example with the following command:
python -m streamlit hello
The result in the browser will be this:
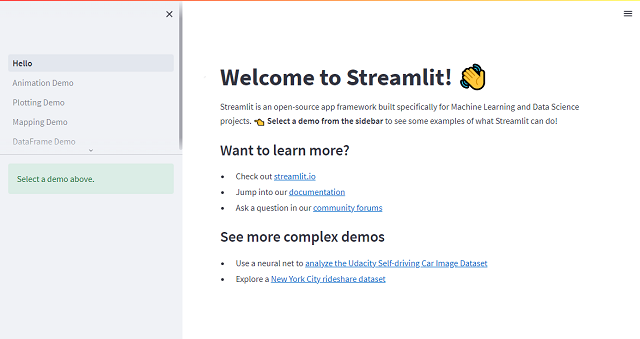
You can create a working folder to add a python file called myapp001.py with the following continue:
import streamlit as st 

st.write("""
#testing streamlit
""")
To run this python file with streamlit use the following command:
python -m streamlit run myapp001.py

  Welcome to Streamlit!

  If you’d like to receive helpful onboarding emails, news, offers, promotions,
  and the occasional swag, please enter your email address below. Otherwise,
  leave this field blank.

  Email:  catafest@yahoo.com

  You can find our privacy policy at https://streamlit.io/privacy-policy

  Summary:
  - This open source library collects usage statistics.
  - We cannot see and do not store information contained inside Streamlit apps,
    such as text, charts, images, etc.
  - Telemetry data is stored in servers in the United States.
  - If you'd like to opt out, add the following to %userprofile%/.streamlit/config.toml,
    creating that file if necessary:

    [browser]
    gatherUsageStats = false


  You can now view your Streamlit app in your browser.
...

Tuesday, October 15, 2019

Python 3.7.4 : Testing python source code with streamlit tool.

The official webpage for this python package can be found at streamlit.io.
Let's install it with pip3 tool:
[mythcat@desk proiecte_github]$ mkdir streamlit_examples
[mythcat@desk proiecte_github]$ cd streamlit_examples/
[mythcat@desk streamlit_examples]$ pip3 install streamlit --user
Let's try some examples.
Create a file named 001.py
This simple example will show a map with randoms spots:
import pandas as pd
import numpy as np
import streamlit as st    
df = pd.DataFrame(
    np.random.randn(100, 2) / [50, 50] + [47.45, 26.3],
    columns=['lat', 'lon'])
st.map(df)
Let's run it with this command:
[mythcat@desk streamlit_examples]$ streamlit run 001.py 

  You can now view your Streamlit app in your browser.

  Local URL: http://localhost:8501
...
The next source code will show just the map because the df variable is empty:
import streamlit as st
df = []
st.deck_gl_chart(
    viewport={
        'latitude': 47.45,
        'longitude': 26.3,
        'zoom': 13,
        'pitch': 50,
    },
    layers=[{
        'type': 'HexagonLayer',
        'data': df,
        'radius': 200,
        'elevationScale': 4,
        'elevationRange': [0, 1000],
        'pickable': True,
        'extruded': True,
    }, {
        'type': 'ScatterplotLayer',
        'data': df,
    }])
The source code is added into another file named 002.py and can be run with this command:
[mythcat@desk streamlit_examples]$ streamlit run 002.py 

  You can now view your Streamlit app in your browser.

  Local URL: http://localhost:8501
...
You can see more about this tool at the official youtube channel: