analitics

Pages

Showing posts with label ephem. Show all posts

Wednesday, January 11, 2023

Python 3.7.9 : simple zodiac diagrams with ephem and matplotlib.

I used openai chat to test another issue with these python packages: ephem and matplotlib.
It seems that openai is limited to new changes in python packages, but it resolves quite well combinations of source code that it has corrected with defined errors. It can't really extract source code from general questions. Anyway, it is a very good help for a programmer in the initial phase of any project.
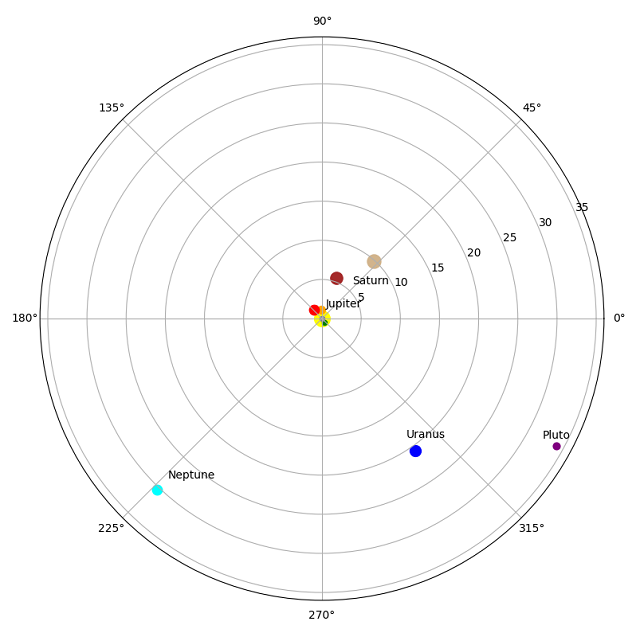
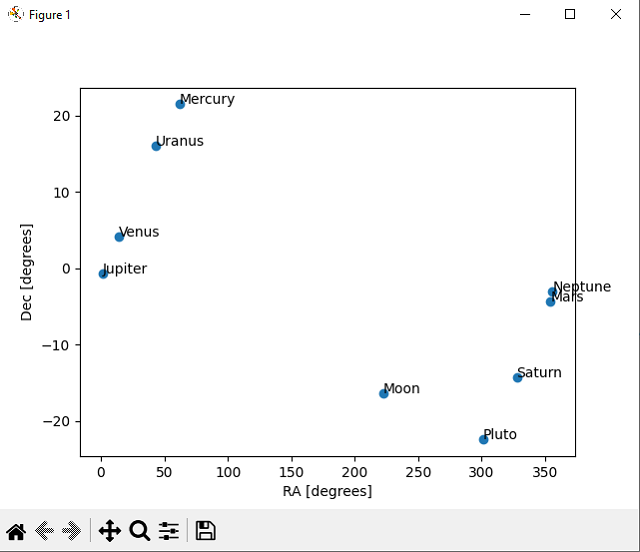
This source code show two diagrams about the solar system on a specific date:
import ephem
import matplotlib.pyplot as plt

# create an observer
obs = ephem.Observer()

# set the observer's location
obs.lat = '47.27' # latitude
obs.lon = '26.18' # longitude
obs.elevation = 307 # elevation (meters)

# set the date and time of the observation
obs.date = '2022/05/15 12:00:00' # date and time
# if you want you can use now() for real time data

# create the bodies
mercury = ephem.Mercury(obs)
venus = ephem.Venus(obs)
mars = ephem.Mars(obs)
jupiter = ephem.Jupiter(obs)
saturn = ephem.Saturn(obs)
uranus = ephem.Uranus(obs)
neptune = ephem.Neptune(obs)
pluto = ephem.Pluto(obs)
moon = ephem.Moon(obs) 

# compute the position of each planet and the moon
mercury.compute(obs)
venus.compute(obs)
mars.compute(obs)
jupiter.compute(obs)
saturn.compute(obs)
uranus.compute(obs)
neptune.compute(obs)
pluto.compute(obs)
moon.compute(obs)  

# extract ra and dec coordinates of each body
ra = [mercury.ra, venus.ra, mars.ra, jupiter.ra, saturn.ra, uranus.ra, neptune.ra, pluto.ra,moon.ra]
dec = [mercury.dec, venus.dec, mars.dec, jupiter.dec, saturn.dec, uranus.dec, neptune.dec, pluto.dec,moon.dec]

# convert ra,dec from radians to degrees
ra = [r*180/ephem.pi for r in ra]
dec = [d*180/ephem.pi for d in dec]
print(ra,dec)
# create a scatter plot of the positions
plt.scatter(ra, dec)

# add labels for each planet
plt.annotate('Mercury', (ra[0], dec[0]))
plt.annotate('Venus', (ra[1], dec[1]))
plt.annotate('Mars', (ra[2], dec[2]))
plt.annotate('Jupiter', (ra[3], dec[3]))
plt.annotate('Saturn', (ra[4], dec[4]))
plt.annotate('Uranus', (ra[5], dec[5]))
plt.annotate('Neptune', (ra[6], dec[6]))
plt.annotate('Pluto', (ra[7], dec[7]))
plt.annotate('Moon', (ra[8], dec[8]))

plt.xlabel("RA [degrees]")
plt.ylabel("Dec [degrees]")

# show the plot
plt.show()

# Set the figure size
plt.figure(figsize=(10, 10))

# Define the polar axis
ax = plt.subplot(111, projection='polar')

# Set the axis limits
ax.set_ylim(0, 36)

# Plot the Sun at the center
plt.scatter(0, 0, s=200, color='yellow')

mercury_distance = mercury.earth_distance
venus_distance= venus.earth_distance
mars_distance= mars.earth_distance
jupiter_distance= jupiter.earth_distance
saturn_distance= saturn.earth_distance
uranus_distance= uranus.earth_distance
neptune_distance= neptune.earth_distance
pluto_distance= pluto.earth_distance
moon_distance= moon.earth_distance
print(mercury_distance)
distance = [mercury_distance,venus_distance,mars_distance,jupiter_distance,saturn_distance,uranus_distance,neptune_distance,pluto_distance,moon_distance]

# Plot the planets
plt.scatter(ra[0], distance[0], s=20, color='green')
plt.scatter(ra[1], distance[1], s=50, color='orange')
plt.scatter(ra[2], distance[2], s=80, color='red')
plt.scatter(ra[3], distance[3], s=120, color='brown')
plt.scatter(ra[4], distance[4], s=150, color='tan')
plt.scatter(ra[5], distance[5], s=100, color='blue')
plt.scatter(ra[6], distance[6], s=80, color='cyan')
plt.scatter(ra[7], distance[7], s=40, color='purple')
plt.scatter(ra[8], distance[8], s=20, color='gray')

# add the labels for each planet
plt.annotate('Mercury',(ra[0], distance[0]),xytext=(ra[0], distance[0] - 2))
plt.annotate('Venus',(ra[1], distance[1]),xytext=(ra[1], distance[1] - 2))
plt.annotate('Mars',(ra[2], distance[2]),xytext=(ra[2], distance[2] - 2))
plt.annotate('Jupiter',(ra[3], distance[3]),xytext=(ra[3], distance[3] - 4))
plt.annotate('Saturn',(ra[4], distance[4]),xytext=(ra[4], distance[4] - 4))
plt.annotate('Uranus',(ra[5], distance[5]),xytext=(ra[5], distance[5] - 2))
plt.annotate('Neptune',(ra[6], distance[6]),xytext=(ra[6], distance[6] - 2))
plt.annotate('Pluto',(ra[7], distance[7]),xytext=(ra[7], distance[7] - 2))
plt.annotate('Moon',(ra[8], distance[8]),xytext=(ra[8], distance[8] - 2))

# Show the plot
plt.show()
This is the result of this source code:
Python 3.7.9 : simple zodiac constellation with ephem.

This time I used openai chat to create my source code and with small changes it worked…
PyEphem provides an ephem Python package for performing high-precision astronomy computations. The underlying numeric routines are coded in C and are the same ones that drive the popular XEphem astronomy application, whose author, Elwood Charles Downey, generously gave permission for their use in PyEphem. The name ephem is short for the word ephemeris, which is the traditional term for a table giving the position of a planet, asteroid, or comet for a series of dates.
import ephem

# create an observer
obs = ephem.Observer()

# set the observer's location
obs.lat = '47.27' # latitude
obs.lon = '26.18' # longitude
obs.elevation = 307 # elevation (meters)

# set the date and time of the observation
obs.date = '2022/05/15 12:00:00' # date and time

# create the bodies
mercury = ephem.Mercury(obs)
venus = ephem.Venus(obs)
mars = ephem.Mars(obs)
jupiter = ephem.Jupiter(obs)
saturn = ephem.Saturn(obs)
uranus = ephem.Uranus(obs)
neptune = ephem.Neptune(obs)
pluto = ephem.Pluto(obs)
moon = ephem.Moon(obs)

# print the constellation
print("Mercury:", ephem.constellation(mercury))
print("Venus:", ephem.constellation(venus))
print("Mars:", ephem.constellation(mars))
print("Jupiter:", ephem.constellation(jupiter))
print("Saturn:", ephem.constellation(saturn))
print("Uranus:", ephem.constellation(uranus))
print("Neptune:", ephem.constellation(neptune))
print("Pluto:", ephem.constellation(pluto))
print("Moon:", ephem.constellation(moon))
This is result of the running source code:
python constelation001.py
Mercury: ('Tau', 'Taurus')
Venus: ('Psc', 'Pisces')
Mars: ('Aqr', 'Aquarius')
Jupiter: ('Psc', 'Pisces')
Saturn: ('Cap', 'Capricornus')
Uranus: ('Ari', 'Aries')
Neptune: ('Psc', 'Pisces')
Pluto: ('Sgr', 'Sagittarius')
Moon: ('Lib', 'Libra')

Tuesday, January 10, 2023

Python 3.7.9 : simple zodiac with pyephem and ephem.

I don't know how to calculate a zodiac exactly, from what I understand the planets and the moon must overlap. so I tested a script that calculates the dates between the planets and the moon when they appear within one degree of each other and displays them in an array with rows and columns created from these planets and the moon. The intersections on the diagonal should be none because there's obviously no way to overlap the same object, and they only occur when there's this less than one degree rule.
If you think it is wrong then you can try to fix it.
You can install pyephem and ephem with pip tool, I used both python packages:
pip install pyephem --user
Requirement already satisfied: pyephem in 
... site-packages (9.99)
Requirement already satisfied: ephem in 
...
site-packages (from pyephem) (4.1.4)
This is the source script.
import ephem

# create a list with planets objects from ephem
planets = [ephem.Mercury(), ephem.Venus(), ephem.Mars(), ephem.Jupiter(), ephem.Saturn(), ephem.Uranus(), ephem.Neptune(), ephem.Moon()]

start_date = ephem.Date("2023/01/01")
end_date = ephem.Date("2023/12/31")
date = start_date

# create matrix to store planet names and conjunction dates
matrix = [[None for _ in range(len(planets) + 1)] for _ in range(len(planets))]

# create list to store planet names
planet_names = [planet.name for planet in planets]
# list all planets names as first row in matrix
matrix.insert(0, [""] + planet_names)

while date < end_date:
    for i, planet1 in enumerate(planets):
        for j, planet2 in enumerate(planets):
            if i < j:
                planet1.compute(date)
                planet2.compute(date)
                sep = ephem.separation(planet1, planet2) #  calculate the angular distance
                # compare the separation, if less than 0.01 degree then it's a conjunction
                if sep < 1.0:
                    date_formatted = date.datetime().strftime("%d %B %Y")
                    matrix[i+1][j+1] = date_formatted
                    break
    date = ephem.Date(date + 1)
# print a matrix with date is separation from 1 degree between planets on rows and column
for row in matrix:
    print(row)
This is the result:
['', 'Mercury', 'Venus', 'Mars', 'Jupiter', 'Saturn', 'Uranus', 'Neptune', 'Moon']
[None, None, '30 December 2023', '14 December 2023', '20 June 2023', None, None, None, None]
[None, None, None, '30 December 2023', '15 March 2023', '06 January 2023', None, None, '12 October 2023']
[None, None, None, None, None, None, '24 April 2023', None, '16 December 2023']
[None, None, None, None, None, '05 June 2023', '30 December 2023', None, None]
[None, None, None, None, None, None, None, '30 December 2023', None]
[None, None, None, None, None, None, None, '30 December 2023', None]
[None, None, None, None, None, None, None, None, '23 December 2023']
[None, None, None, None, None, None, None, None, None]

Friday, July 31, 2020

Python 3.8.5 : PyEphem astronomy library for Python - part 001.

About this python package, you can find it from the official website.
PyEphem provides an ephem Python package for performing high-precision astronomy computations. The underlying numeric routines are coded in C and are the same ones that drive the popular XEphem astronomy application, whose author, Elwood Charles Downey, generously gave permission for their use in PyEphem. The name ephem is short for the word ephemeris, which is the traditional term for a table giving the position of a planet, asteroid, or comet for a series of dates.
Because I like astronomy and lately a lot has happened in this field, I thought I would come up with some simple tutorials for those who are interested.
This tutorial is tested on a Linux distribution called Fedora 32 with Python version 3.8.5.
I installed this python packet with the pip3 tool.
[mythcat@desk ~]$ sudo pip3 install ephem --user
WARNING: Running pip install with root privileges is generally not a good idea. 
Try `pip3 install --user` instead.
Collecting ephem
...
Installing collected packages: ephem
Successfully installed ephem-3.7.7.1
You know that NASA has launched the Mars Perseverance rover, so let's play with this topic a bit.
Let's see current azimuth and elevation for planet Mars.
For this is need the position of the observer and then is compute the position of the planet Mars.
I used the position of the Greenwich for the observer, but you can create your oun observer and use it.
[mythcat@desk ~]$ python3
Python 3.8.5 (default, Jul 20 2020, 00:00:00) 
[GCC 10.1.1 20200507 (Red Hat 10.1.1-1)] on linux
Type "help", "copyright", "credits" or "license" for more information.
>>> import ephem
>>> import math
>>> convert = math.pi / 180.
>>> mars = ephem.Mars()
>>> greenwich = ephem.Observer()
>>> greenwich.lat = "51.477928"
>>> greenwich.lon = "-0.001545"
>>> mars.compute(greenwich)
>>> az_deg, alt_deg = mars.az*convert, mars.alt*convert
>>> print(f"Mars' current azimuth and elevation: {az_deg:.2f} {alt_deg:.2f}")
Mars' current azimuth and elevation: 0.11 -0.01
Let's see another example with Mars to take ascension and declination for the epoch specified:
...
>>> import datetime
>>> now = datetime.datetime.now()
>>> print(now)
2020-07-31 19:11:42.312027
>>> mars.compute(now)
>>> print(mars.ra)
1:12:43.64
>>> print(mars.dec)
3:33:22.6
You can get the magnitude, size (diameter in arcseconds) and size (radius as an angle):
>>> print(mars.mag)
-1.11
>>> print(mars.size)
14.555475234985352
>>> print(mars.radius)
0:00:07.3
You can easily see which constellation Mars is on.
>>> ephem.constellation(mars)
('Psc', 'Pisces')