analitics

Pages

Showing posts with label numpy. Show all posts

Monday, December 16, 2024

Python 3.12.8 : Install quil in Fedora 41.

The quil python package on Fedora 41 can be used with the 3.12.8 version of python :
Python 3.12.8 (main, Dec  6 2024, 00:00:00) [GCC 14.2.1 20240912 (Red Hat 14.2.1-3)] on linux
mythcat@localhost:~$ python3.12 -m pip install quil --user
First, install the python version then install the pip tool:
mythcat@localhost:~$ curl https://bootstrap.pypa.io/get-pip.py | python3.12 -
...
Installing collected packages: pip
Successfully installed pip-24.3.1
Next, install with the pip version:
mythcat@localhost:~$ python3.12 -m pip install quil --user
Collecting quil

Saturday, December 14, 2024

Python 3.13.0 : OpenCV - part 002.

The PyQt6 python package and Fedora works great. I tested today this source code with opencv, numpy, PyQt6 python packages.
I install opencv python package with dnf5 tool:
root@localhost:/home/mythcat# dnf5 install  python3-opencv.x86_64
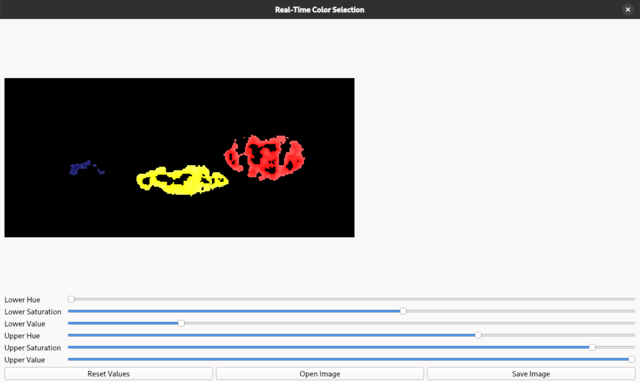
The source code let you to open, change a image and save using sliders and a reset option.
This is the source code:
import sys
import cv2
import numpy as np
from PyQt6.QtWidgets import QApplication, QMainWindow, QWidget, QVBoxLayout, QLabel, QSlider, QFileDialog, QPushButton, QHBoxLayout
from PyQt6.QtGui import QImage, QPixmap
from PyQt6.QtCore import Qt, pyqtSlot

class MainWindow(QMainWindow):
    def __init__(self):
        super().__init__()
        self.setWindowTitle("Real-Time Color Selection")
        self.setGeometry(100, 100, 1200, 800)

        # Create central widget and main layout
        central_widget = QWidget()
        self.setCentralWidget(central_widget)
        main_layout = QVBoxLayout(central_widget)

        # Create image label
        self.image_label = QLabel()
        main_layout.addWidget(self.image_label)

        # Initialize sliders
        self.lower_h = QSlider(Qt.Orientation.Horizontal)
        self.lower_s = QSlider(Qt.Orientation.Horizontal)
        self.lower_v = QSlider(Qt.Orientation.Horizontal)
        self.upper_h = QSlider(Qt.Orientation.Horizontal)
        self.upper_s = QSlider(Qt.Orientation.Horizontal)
        self.upper_v = QSlider(Qt.Orientation.Horizontal)

        # Set slider ranges
        for slider in [self.lower_h, self.upper_h]:
            slider.setRange(0, 179)
        for slider in [self.lower_s, self.lower_v, self.upper_s, self.upper_v]:
            slider.setRange(0, 255)

        # Set initial slider values
        self.lower_h.setValue(50)
        self.lower_s.setValue(100)
        self.lower_v.setValue(50)
        self.upper_h.setValue(130)
        self.upper_s.setValue(255)
        self.upper_v.setValue(255)

        # Connect sliders to update function
        self.lower_h.valueChanged.connect(self.update_hsv_range)
        self.lower_s.valueChanged.connect(self.update_hsv_range)
        self.lower_v.valueChanged.connect(self.update_hsv_range)
        self.upper_h.valueChanged.connect(self.update_hsv_range)
        self.upper_s.valueChanged.connect(self.update_hsv_range)
        self.upper_v.valueChanged.connect(self.update_hsv_range)

        # Create slider layouts with labels
        sliders_layout = QVBoxLayout()
        
        # Add slider pairs with labels
        slider_pairs = [
            ("Lower Hue", self.lower_h),
            ("Lower Saturation", self.lower_s),
            ("Lower Value", self.lower_v),
            ("Upper Hue", self.upper_h),
            ("Upper Saturation", self.upper_s),
            ("Upper Value", self.upper_v)
        ]

        for label_text, slider in slider_pairs:
            row_layout = QHBoxLayout()
            label = QLabel(label_text)
            label.setMinimumWidth(120)
            row_layout.addWidget(label)
            row_layout.addWidget(slider)
            sliders_layout.addLayout(row_layout)

        main_layout.addLayout(sliders_layout)

        # Add buttons
        button_layout = QHBoxLayout()
        
        self.reset_button = QPushButton("Reset Values")
        self.reset_button.clicked.connect(self.reset_values)
        button_layout.addWidget(self.reset_button)

        self.open_image_button = QPushButton("Open Image")
        self.open_image_button.clicked.connect(self.open_image)
        button_layout.addWidget(self.open_image_button)

        self.save_button = QPushButton("Save Image")
        self.save_button.clicked.connect(self.save_image)
        button_layout.addWidget(self.save_button)
        main_layout.addLayout(button_layout)

        # Process initial image
        self.process_image()

    def process_image(self):
        image_bgr = cv2.imread("image.png")
        if image_bgr is None:
            image_bgr = cv2.imread("default_image.png")
        
        self.image_bgr = image_bgr
        self.image_hsv = cv2.cvtColor(image_bgr, cv2.COLOR_BGR2HSV)

        # Create initial mask using current slider values
        lower_values = np.array([self.lower_h.value(), self.lower_s.value(), self.lower_v.value()])
        upper_values = np.array([self.upper_h.value(), self.upper_s.value(), self.upper_v.value()])
        
        mask_test = cv2.inRange(self.image_hsv, lower_values, upper_values)
        image_bgr_masked = cv2.bitwise_and(image_bgr, image_bgr, mask=mask_test)
        self.image_rgb = cv2.cvtColor(image_bgr_masked, cv2.COLOR_BGR2RGB)
        self.update_image()

    def update_image(self):
        height, width, channel = self.image_rgb.shape
        bytes_per_line = width * channel
        q_image = QImage(self.image_rgb.data, width, height, bytes_per_line, QImage.Format.Format_RGB888)
        pixmap = QPixmap.fromImage(q_image)
        self.image_label.setPixmap(pixmap.scaled(700, 500, Qt.AspectRatioMode.KeepAspectRatio))

    def update_hsv_range(self):
        lower_values = np.array([self.lower_h.value(), self.lower_s.value(), self.lower_v.value()])
        upper_values = np.array([self.upper_h.value(), self.upper_s.value(), self.upper_v.value()])
        mask_test = cv2.inRange(self.image_hsv, lower_values, upper_values)
        image_bgr_masked = cv2.bitwise_and(self.image_bgr, self.image_bgr, mask=mask_test)
        self.image_rgb = cv2.cvtColor(image_bgr_masked, cv2.COLOR_BGR2RGB)
        self.update_image()

    def reset_values(self):
        self.lower_h.setValue(50)
        self.lower_s.setValue(100)
        self.lower_v.setValue(50)
        self.upper_h.setValue(130)
        self.upper_s.setValue(255)
        self.upper_v.setValue(255)

    def open_image(self):
        filename, _ = QFileDialog.getOpenFileName(self, "Select Image File", "", "Image Files (*.png *.jpg *.jpeg)")
        if filename:
            self.image_bgr = cv2.imread(filename)
            if self.image_bgr is not None:
                self.image_hsv = cv2.cvtColor(self.image_bgr, cv2.COLOR_BGR2HSV)
                self.update_hsv_range()  # This will apply current filter and update display

    def save_image(self):
        filename, _ = QFileDialog.getSaveFileName(self, "Save Image", "", "PNG Files (*.png);;JPEG Files (*.jpg)")
        if filename:
            # Make sure filename has an extension
            if not filename.endswith(('.png', '.jpg', '.jpeg')):
                filename += '.png'
            # Convert and save
            output_image = cv2.cvtColor(self.image_rgb, cv2.COLOR_RGB2BGR)
            cv2.imwrite(filename, output_image)

if __name__ == "__main__":
    app = QApplication(sys.argv)
    window = MainWindow()
    window.show()
    sys.exit(app.exec())

Thursday, April 4, 2024

News : SciPy 1.13.0 new release.

SciPy 1.13.0 is the culmination of 3 months of hard work. This out-of-band release aims to support NumPy 2.0.0, and is backwards compatible to NumPy 1.22.4. The version of OpenBLAS used to build the PyPI wheels has been increased to 0.3.26.dev.
This release requires Python 3.9+ and NumPy 1.22.4 or greater.
For running on PyPy, PyPy3 6.0+ is required.
This release can be found on the official GitHub repo.
python -m pip install --upgrade pip
Requirement already satisfied: pip in c:\python312\lib\site-packages (24.0)
...
python -m pip install --upgrade matplotlib
Collecting matplotlib
  Downloading matplotlib-3.8.4-cp312-cp312-win_amd64.whl.metadata (5.9 kB)
...
Successfully installed contourpy-1.2.1 cycler-0.12.1 fonttools-4.50.0 kiwisolver-1.4.5 matplotlib-3.8.4
...
python -m pip install --upgrade scipy
Collecting scipy
  Downloading scipy-1.13.0-cp312-cp312-win_amd64.whl.metadata (60 kB)
...
Successfully installed scipy-1.13.0
I tested the interpolate.Akima1DInterpolator changes with the default python script and works well:
import numpy as np
from scipy.interpolate import Akima1DInterpolator

import matplotlib.pyplot as plt
fig, ax = plt.subplots()

x = np.linspace(1, 7, 7)
y = np.array([-1, -1, -1, 0, 1, 1, 1])
xs = np.linspace(min(x), max(x), num=100)
y_akima = Akima1DInterpolator(x, y, method="akima")(xs)
y_makima = Akima1DInterpolator(x, y, method="makima")(xs)


ax.plot(x, y, "o", label="data")
ax.plot(xs, y_akima, label="akima")
ax.plot(xs, y_makima, label="makima")

ax.set_title('Fruit supply by kind and color')
ax.legend(title='Fruit color')

plt.show()
about Akima piecewise cubic Hermite interpolation.
Akima interpolator Fit piecewise cubic polynomials, given vectors x and y. The interpolation method by Akima uses a continuously differentiable sub-spline built from piecewise cubic polynomials. The resultant curve passes through the given data points and will appear smooth and natural.
The result of this source code is this:

Sunday, March 31, 2024

Python 3.12.1 : About multiprocessing performance.

Today I test a simple python script for Pool and ThreadPool python classes from multiprocessing python module.
The main goal was to test Python’s multiprocessing performance with my computer.
NumPy releases the GIL for many of its operations, which means you can use multiple CPU cores even with threads.
Processing large amounts of data with Pandas can be difficult, and with Polars dataframe library is a potential solution.
Sciagraph gives you both performance profiling and peak memory profiling information.
Let's teste only these class:
The multiprocessing.pool.Pool class provides a process pool in Python.
The multiprocessing.pool.ThreadPool class in Python provides a pool of reusable threads for executing spontaneous tasks.
This is the python script:
from time import time
import multiprocessing as mp
from multiprocessing.pool import ThreadPool
import numpy as np
import pickle

def main():
    arr = np.ones((1024, 1024, 1024), dtype=np.uint8)
    expected_sum = np.sum(arr)

    with ThreadPool(1) as threadpool:
        start = time()
        assert (
            threadpool.apply(np.sum, (arr,)) == expected_sum
        )
        print("Thread pool:", time() - start)

    with mp.get_context("spawn").Pool(1) as process_pool:
        start = time()
        assert (
            process_pool.apply(np.sum, (arr,))
            == expected_sum
        )
        print("Process pool:", time() - start)

if __name__ == "__main__":
    main()
This is the result:
python thread_process_pool_001.py
Thread pool: 1.6689703464508057
Process pool: 11.644825458526611

Sunday, December 10, 2023

Python 3.10.12 : Simple examples with some Python modules - part 042.

I added some simple examples in my repo on GitHub where I have notebooks from Google Colab.
Python usage is limited to this type of interface with Python version stability rules.
You can see the Python version that Colab is using with this command in the code area:
!python
Python 3.10.12 (main, Nov 20 2023, 15:14:05) [GCC 11.4.0] on linux
Type "help", "copyright", "credits" or "license" for more information.
These are the Python packages I used: cartopy, matplotlib, numpy, geemap, earthengine-api, rasterio.
Of these examples, some require some Google configuration, others require knowledge of topography ... or are very simple to use with a dedicated module as we have visualized more special types of image files.
See there an example with the cartopy python package :
import matplotlib.pyplot as plt

import cartopy.crs as ccrs
from cartopy.io import shapereader
from cartopy.mpl.gridliner import LONGITUDE_FORMATTER, LATITUDE_FORMATTER

import cartopy.io.img_tiles as cimgt

extent = [15, 25, 55, 35]

request = cimgt.OSM()

fig = plt.figure(figsize=(9, 13))
ax = plt.axes(projection=request.crs)
gl = ax.gridlines(draw_labels=True, alpha=0.2)
gl.top_labels = gl.right_labels = False
gl.xformatter = LONGITUDE_FORMATTER
gl.yformatter = LATITUDE_FORMATTER

ax.set_extent(extent)

ax.add_image(request, 11)

plt.show()

Sunday, August 13, 2023

Python 3.10.12 : My colab test with Gated recurrent unit mechanism - part 037.

This is a simple example for Gated recurrent unit mechanism known as GRUs.
You can find this in my GitHub colab project.
import numpy as np
import tensorflow as tf
import keras
from keras import layers
units = 64
tf.keras.layers.GRU(
    units,
    activation="tanh",
    recurrent_activation="sigmoid",
    use_bias=True,
    kernel_initializer="glorot_uniform",
    recurrent_initializer="orthogonal",
    bias_initializer="zeros",
    kernel_regularizer=None,
    recurrent_regularizer=None,
    bias_regularizer=None,
    activity_regularizer=None,
    kernel_constraint=None,
    recurrent_constraint=None,
    bias_constraint=None,
    dropout=0.0,
    recurrent_dropout=0.0,
    return_sequences=False,
    return_state=False,
    go_backwards=False,
    stateful=False,
    unroll=False,
    time_major=False,
    reset_after=True,
)
inputs = tf.random.normal([32, 10, 8])
gru = tf.keras.layers.GRU(4)
output = gru(inputs)
print(output.shape)

gru = tf.keras.layers.GRU(4, return_sequences=True, return_state=True)
whole_sequence_output, final_state = gru(inputs)
print(whole_sequence_output.shape)
print(final_state.shape)

Thursday, January 12, 2023

Python 3.11.0 : The numpy-quaternion python package - part 001.

I write an article on my website about artificial intelligence and I used python to show a simple example with quaternions.
This Python module adds a quaternion dtype to NumPy and you can read about this on the official website.
I may have mistakenly installed a python packet with a similar name and I had to install it with the command:
python -m pip uninstall quaternion
the next step was to install this command
python -m pip install --upgrade --no-deps --force-reinstall numpy-quaternion
The source code I used defines two quaternions, one with real part a and imaginary parts, and one quaternion using Euler angles.
Then is perform the rotation uses quaternion multiplication.
Let's see the source code
import numpy as np
import quaternion

# define a quaternion with real part a and imaginary parts bi, cj, dk
a = 1
b = 2
c = 3
d = 4
q = np.quaternion(a, b, c, d)

# define a quaternion using euler angles
x = 1.0
y = 2.0
z = 3.0
q2 = quaternion.from_euler_angles(x, y, z)

# define a vector to rotate
v = [1, 0, 0]

# perform the rotation using quaternion multiplication

# quaternion multiplication is not commutative, the order matters
# because this line of source code will not work:  rotated_v = q2 * v * q2.conj()

rotated_v = (q2 * quaternion.quaternion(0, *v)) * q2.conj()

print(rotated_v)
This is the result:
quaternion(0, 0.103846565151668, 0.422918571742548, 0.900197629735517)

Monday, September 21, 2020

Python 3.8.5 : A sphere in Cartesian coordinates - part 001.

I like the equation of a sphere of radius R centered at the origin is given in Cartesian coordinates:

x*x + y*y + z*z = r*r

It is one of the first elements that helped me better understand mathematics and later the dynamics and theory of electromagnetic fields.

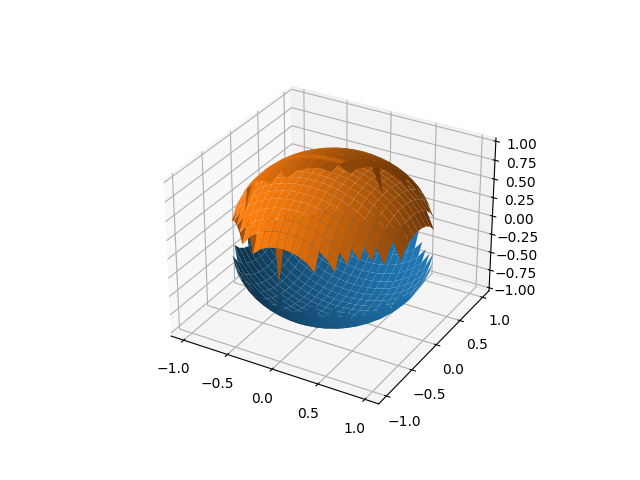
I did not find a graphical representation using python as accurately as possible without eliminating the discretion of the range from -1 and 1 and radius * radius = 1.

The main reason is the plot_surface from matplotlib python package.

This is output of my script:

[mythcat@desk ~]$ python sphere_xyz.py 
[-1.         -0.91666667 -0.83333333 -0.75       -0.66666667 -0.58333333
 -0.5        -0.41666667 -0.33333333 -0.25       -0.16666667 -0.08333333
  0.          0.08333333  0.16666667  0.25        0.33333333  0.41666667
  0.5         0.58333333  0.66666667  0.75        0.83333333  0.91666667
  1.        ]
sphere_xyz.py:7: RuntimeWarning: invalid value encountered in sqrt
  return np.sqrt(1-x**2 - y**2)
sphere_xyz.py:18: UserWarning: Z contains NaN values. This may result in rendering artifacts.
  surface1 = ax.plot_surface(X2, Y2, -Z2,rstride=1, cstride=1, linewidth=0,antialiased=True)
sphere_xyz.py:19: UserWarning: Z contains NaN values. This may result in rendering artifacts.
  surface2 = ax.plot_surface(X2, Y2, Z2,rstride=1, cstride=1, linewidth=0,antialiased=True)

The image result is this:

The source code is this:

import matplotlib.pyplot as plt
import numpy as np
from matplotlib.colors import LightSource

#@np.vectorize
def solve_Z2(x,y):
    return np.sqrt(1-x**2 - y**2)

fig = plt.figure()
ax = fig.gca(projection='3d')

xrange2 = np.linspace(-1.0, 1.0, 25)
yrange2 = np.linspace(-1.0, 1.0, 25)
print(xrange2)
X2, Y2 = np.meshgrid(xrange2, yrange2)
Z2 = solve_Z2(X2, Y2)

surface1 = ax.plot_surface(X2, Y2, -Z2,rstride=1, cstride=1, linewidth=0,antialiased=True)
surface2 = ax.plot_surface(X2, Y2, Z2,rstride=1, cstride=1, linewidth=0,antialiased=True)

plt.show()

Sunday, August 30, 2020

Python 3.8.5 : Testing with openpyxl - part 002 .

Today I will show you how can use Levenshtein ratio and distance between two strings, see wikipedia.
I used three files created with LibreOffice and save it like xlsx file type.
All of these files come with the column A fill with strings of characters, in this case, numbers.
The script will read all of these files from the folder named xlsx_files and will calculate Levenshtein ratio and distance between the strings of name of these files and column A.
Finally, the result is shown into a graph with matplotlib python package.
Let's see the python script:
import os
from glob import glob

from openpyxl import load_workbook
import numpy as np 
import matplotlib.pyplot as plt 

def levenshtein_ratio_and_distance(s, t, ratio_calc = False):
    """ levenshtein_ratio_and_distance - distance between two strings.
        If ratio_calc = True, the function computes the
        levenshtein distance ratio of similarity between two strings
        For all i and j, distance[i,j] will contain the Levenshtein
        distance between the first i characters of s and the
        first j characters of t
    """
    # Initialize matrix of zeros
    rows = len(s)+1
    cols = len(t)+1
    distance = np.zeros((rows,cols),dtype = int)

    # Populate matrix of zeros with the indeces of each character of both strings
    for i in range(1, rows):
        for k in range(1,cols):
            distance[i][0] = i
            distance[0][k] = k
    for col in range(1, cols):
        for row in range(1, rows):
            # check the characters are the same in the two strings in a given position [i,j] 
            # then the cost is 0
            if s[row-1] == t[col-1]:
                cost = 0 
            else:             
                # calculate distance, then the cost of a substitution is 1.
                if ratio_calc == True:
                    cost = 2
                else:
                    cost = 1
            distance[row][col] = min(distance[row-1][col] + 1,      # Cost of deletions
                                 distance[row][col-1] + 1,          # Cost of insertions
                                 distance[row-1][col-1] + cost)     # Cost of substitutions
    if ratio_calc == True:
        # Ration computation of the Levenshtein Distance Ratio
        Ratio = ((len(s)+len(t)) - distance[row][col]) / (len(s)+len(t))
        return Ratio
    else:
        return distance[row][col]


PATH = "/home/mythcat/xlsx_files/"
result = [y for x in os.walk(PATH) for y in glob(os.path.join(x[0], '*.xlsx'))]
result_files = [os.path.join(path, name) for path, subdirs, files in os.walk(PATH) for name in files]
#print(result)
row_0 = []

for r in result:
    n = 0
    wb = load_workbook(r)
    sheets = wb.sheetnames
    ws = wb[sheets[n]]
    for row in ws.rows:
            if (row[0].value) != None :
                rows = row[0].value
                row_0.append(rows)

print("All rows of column A ")
print(row_0)
files = []
for f in result_files:
    ff = str(f).split('/')[-1:][0]
    fff = str(ff).split('.xlsx')[0]
    files.append(fff)

print(files)
# define tree lists for levenshtein
list1 = []
list2 = []

for l in row_0:
    str(l).lower()
    for d in files:
        Distance = levenshtein_ratio_and_distance(str(l).lower(),str(d).lower())   
        Ratio = levenshtein_ratio_and_distance(str(l).lower(),str(d).lower(),ratio_calc = True)
        list1.append(Distance)
        list2.append(Ratio)
        
print(list1, list2)
# plotting the points  
plt.plot(list1,'g*', list2, 'ro' )
plt.show()
The result is this:
[mythcat@desk ~]$ python test_xlsx.py
All rows of column A 
[11, 2, 113, 4, 1111, 4, 4, 111, 2, 1111, 5, 4, 4, 3, 1111, 1, 2, 1113, 4, 115, 1, 2, 221, 1, 1,
 43536, 2, 34242, 3, 1]
['001', '002', '003']
[2, 3, 3, 3, 2, 3, 3, 3, 2, 3, 3, 3, 3, 4, 4, 3, 3, 3, 3, 3, 3, 2, 3, 3, 3, 2, 3, 3, 4, 4, 3, 3, 
3, 3, 3, 3, 3, 3, 3, 3, 3, 2, 3, 4, 4, 2, 3, 3, 3, 2, 3, 3, 4, 3, 3, 3, 3, 3, 3, 3, 2, 3, 3, 3, 
2, 3, 2, 3, 3, 2, 3, 3, 2, 3, 3, 5, 5, 4, 3, 2, 3, 5, 4, 5, 3, 3, 2, 2, 3, 3] [0.4, 0.0, 0.0, 0.0, 
0.5, 0.0, 0.3333333333333333, 0.0, 0.3333333333333333, 0.0, 0.0, 0.0, 0.2857142857142857, 0.0, 0.0,
 0.0, 0.0, 0.0, 0.0, 0.0, 0.0, 0.3333333333333333, 0.0, 0.0, 0.0, 0.5, 0.0, 0.2857142857142857, 0.0,
 0.0, 0.0, 0.0, 0.0, 0.0, 0.0, 0.0, 0.0, 0.0, 0.0, 0.0, 0.0, 0.5, 0.2857142857142857, 0.0, 0.0, 0.5,
 0.0, 0.0, 0.0, 0.5, 0.0, 0.2857142857142857, 0.0, 0.2857142857142857, 0.0, 0.0, 0.0, 0.3333333333333333,
 0.0, 0.0, 0.5, 0.0, 0.0, 0.0, 0.5, 0.0, 0.3333333333333333, 0.3333333333333333, 0.0, 0.5, 0.0, 0.0,
 0.5, 0.0, 0.0, 0.0, 0.0, 0.25, 0.0, 0.5, 0.0, 0.0, 0.25, 0.25, 0.0, 0.0, 0.5, 0.5, 0.0, 0.0]

Sunday, August 9, 2020

Python 3.8.5 : Pearson Product Moment Correlation with corrcoef from numpy.

The python package named numpy come with corrcoef function to return Pearson product-moment correlation coefficients.
This method has a limitation in that it can compute the correlation matrix between two variables only.
The full name is the Pearson Product Moment Correlation (PPMC).
The PPMC is not able to tell the difference between dependent variables and independent variables.
The documentation about this function can be found here.
More examples of Pearson Correlation can be found on this website.
My example presented in this tutorial, use the random packet to randomly generate integers and then calculate the correlation coefficients.
All of these are calculated five times in a for a cycle and each time the seed parameters are changed randomly.
Each time the correlation matrices are printed and then the random number graphs are displayed.
Let's see the source code:
import random

import numpy as np

nr_integers = 100
size_integers = 100

import matplotlib
import matplotlib.pyplot as plt

# set from 0 to 4 seed for random and show result 
for e in range(5):
    # change random seed
    np.random.seed(e)
    # nr_integers random integers between 0 and size_integers
    x = np.random.randint(0, size_integers, nr_integers)
    # Positive Correlation with some noise created with
    # nr_integers random integers between 0 and size_integers
    positive_y = x + np.random.normal(0, size_integers, nr_integers)
    correlation_positive = np.corrcoef(x, positive_y)
    # show matrix for correlation_positive
    print(correlation_positive)
    # Negative Correlation with same noise created with 
    # nr_integers random integers between 0 and size_integers
    negative_y = 100 - x + np.random.normal(0, size_integers, nr_integers)
    correlation_negative = np.corrcoef(x, negative_y)
    # show matrix for output with plt
    print(correlation_negative)
    # set graphic for plt with two graphics for each output with subplot
    plt.subplot(1, 2, 1)
    plt.scatter(x,positive_y)
    plt.subplot(1, 2, 2)
    plt.scatter(x,negative_y)
    # show the graph 
    plt.show()


Saturday, June 20, 2020

Python 3.8.3 : Using twitter application with python-twitter - part 001.

You need to create a application for your twitter user developer on this webpage.
The next step is to get all keys and tokens from your application.
I used the python-twitter see the official webpage documentation.
Let's install this python module using the pip tool
pip install python-twitter
Collecting python-twitter
...
Installing collected packages: oauthlib, requests-oauthlib, python-twitter
Successfully installed oauthlib-3.1.0 python-twitter-3.5 requests-oauthlib-1.3.0
Let's see a simple source code:
import os
import matplotlib
import matplotlib.pyplot as plt
import numpy as np
import twitter
import datetime
from datetime import *

consumer_key=' '
consumer_secret=' '
token_key=' '
token_secret=' '

def get_tweets(api=None, screen_name=None):
    timeline = api.GetUserTimeline(screen_name=screen_name, count=200)
    earliest_tweet = min(timeline, key=lambda x: x.id).id
    print("getting tweets before:", earliest_tweet)

    while True:
        tweets = api.GetUserTimeline(
            screen_name=screen_name, max_id=earliest_tweet, count=200
        )
        new_earliest = min(tweets, key=lambda x: x.id).id

        if not tweets or new_earliest == earliest_tweet:
            break
        else:
            earliest_tweet = new_earliest
            print("getting tweets before:", earliest_tweet)
            timeline += tweets

    return timeline

if __name__ == "__main__":
    api = twitter.Api(consumer_key=consumer_key,
                  consumer_secret=consumer_secret,
                  access_token_key=token_key,
                  access_token_secret=token_secret) 
    # print api 
    #print(dir(api))
    
    # print all users of this account authentificated 
    #users = api.GetFriends()
    #print([u.screen_name for u in users])
    
    # print all tweets of my user catafest 
    screen_name = "catafest"
    timeline = get_tweets(api=api, screen_name=screen_name)
    dates = []
    for x in timeline:
        created = x.created_at
        dates.append(created)
        
    print(dates)
    dat = [datetime.strptime(d, "%a %b %d %H:%M:%S +0000 %Y") for d in dates]

    levels = np.tile([-8, 8, -4, 4, -1, 1],int(np.ceil(len(dat)/3)))[:len(dat)]
    print(levels)
    fig, ax = plt.subplots(figsize=(7.6, 5), constrained_layout=True)
    ax.set(title="Twitter dates")
    markerline, stemline, baseline = ax.stem(dat, levels,linefmt="C3-", basefmt="k-",use_line_collection=True)
    markerline.set_ydata(np.zeros(len(dat)))
    plt.setp(markerline, mec="k", mfc="w", zorder=1)
    plt.show()
The result of this script comes with this output:
python .\test_webpage_001.py
getting tweets before: 1123237192422367234
['Mon May 18 13:52:09 +0000 2020', 'Sat May 09 11:14:43 +0000 2020', 'Fri May 08 10:42:18 +0000 2020', 
'Fri May 08 10:41:37 +0000 2020', 'Sat May 02 17:41:07 +0000 2020', 'Sat May 02 17:39:15 +0000 2020', 
'Thu Apr 30 12:53:48 +0000 2020', 'Tue Apr 28 20:00:38 +0000 2020', 'Mon Apr 27 21:12:07 +0000 2020', 
'Fri Apr 24 16:39:58 +0000 2020', 'Fri Apr 24 16:09:26 +0000 2020', 'Sat Apr 11 16:56:40 +0000 2020', 
'Sun Mar 22 19:11:16 +0000 2020', 'Sat Mar 21 09:03:30 +0000 2020', 'Sat Mar 21 09:02:48 +0000 2020', 
'Sat Mar 21 08:59:18 +0000 2020', 'Mon Mar 16 06:29:34 +0000 2020', 'Fri Jan 24 19:59:38 +0000 2020', 
'Sat Jan 18 12:14:07 +0000 2020', 'Fri Jan 17 20:58:18 +0000 2020', 'Thu Jan 16 20:50:47 +0000 2020', 
'Thu Jan 16 20:49:16 +0000 2020', 'Fri Jan 03 17:57:33 +0000 2020', 'Sat Dec 28 10:14:11 +0000 2019', 
'Tue Apr 30 14:46:30 +0000 2019']
[-8  8 -4  4 -1  1 -8  8 -4  4 -1  1 -8  8 -4  4 -1  1 -8  8 -4  4 -1  1 -8]
The image show with matplotlib is this:

Monday, March 16, 2020

Python 3.5.2 : Detect motion and save images with opencv.

This script is simple to use it with a webcam or to parse a video file.
The main goal of this script is to see the difference in various frames of a video or webcam output.
The first frame of our video file will contain no motion and just background and then is compute the absolute difference.
There is no need to process the large, raw images straight from the video stream and this is the reason I convert the image to grayscale.
Some text is put on the window to show us the status string to indicate it is detection.
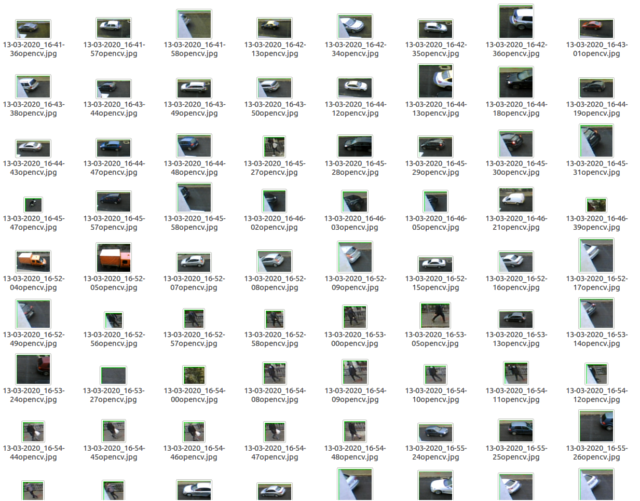
With this script I detect cars and peoples from my window, see the screenshot with these files:

Let's see the python script:
import argparse
import datetime
import imutils

import cv2

import time
from time import sleep

def saveJpgImage(frame):
    #process image
    img_name = "opencv_frame_{}.jpg".format(time)
    cv2.imwrite(img_name, frame)

def savePngImage():
    #process image
    img_name = "opencv_frame_{}.png".format(time)
    cv2.imwrite(img_name, frame)

# get argument parse
ap = argparse.ArgumentParser()
ap.add_argument("-v", "--video", help="path to the video file")
ap.add_argument("-s", "--size", type=int, default=480, help="minimum area size , default 480")
args = vars(ap.parse_args())

# if no video use webcam
if args.get("video", None) is None:
    camera = cv2.VideoCapture(0)
    #time.sleep(1.5)

# use video file
else:
    camera = cv2.VideoCapture(args["video"])


# frame from video is none 
first_frame = None

# loop into frames of the video
while True:
    # grab the current frame 
    (grabbed, frame) = camera.read()
    text = "undetected"

    # is no frame grabbed the is end of video 
    if not grabbed:
        break

    # resize the frame 
    frame = imutils.resize(frame, width=640)
    gray = cv2.cvtColor(frame, cv2.COLOR_BGR2GRAY)
    gray = cv2.GaussianBlur(gray, (21, 21), 0)

    # is first frame is none , make gray 
    if first_frame is None:
        first_frame = gray
        continue


    # compute difference from current frame and first frame 
    frameDelta = cv2.absdiff(first_frame, gray)
    first_frame = gray
    thresh = cv2.threshold(frameDelta, 1, 255, cv2.THRESH_BINARY)[1]

    # dilate the thresholded image to fill in holes
    # then find contours on thresholded image
    thresh = cv2.dilate(thresh, None, iterations=2)
    (cnts, _) = cv2.findContours(thresh.copy(), cv2.RETR_EXTERNAL,
                                 cv2.CHAIN_APPROX_SIMPLE)

    # loop contours 
    for c in cnts:
        # if the contour is too small, ignore it
        if cv2.contourArea(c) < args["size"]:
            continue

        # compute the bounding box for the contour
        # draw it on the frame,
        # and update the text
        (x, y, w, h) = cv2.boundingRect(c)
        cv2.rectangle(frame, (x, y), (x + w, y + h), (0, 255, 0), 0)
        roi = frame[y:y+h, x:x+w]
        ts = time.time()
        st = datetime.datetime.fromtimestamp(ts).strftime('%d-%m-%Y_%H-%M-%S')
        # if the detection is on sized then save the image 
        if (w > h ) and (y + h) > 50 and (y + h) < 550:
            cv2.imwrite(st+"opencv.jpg", roi)
        # set text to show on gui 
        text = "detected"
    
    # draw the text and timestamp on the frame
    cv2.putText(frame, "Detect: {}".format(text), (10, 20),
                cv2.FONT_HERSHEY_SIMPLEX, 0.5, (0, 0, 255), 2)
    cv2.putText(frame, datetime.datetime.now().strftime("%A %d %B %Y %I:%M:%S%p"),
                (10, frame.shape[0] - 10), cv2.FONT_HERSHEY_SIMPLEX, 0.35, (0, 0, 255), 1)

    #show frame , thresh and frame_Delta
    cv2.imshow("Security Feed", frame)
    cv2.imshow("Thresh", thresh)
    cv2.imshow("Frame Delta", frameDelta)
    key = cv2.waitKey(1) &  0xFF

    # break from loop with q key 
    if key == ord("q"):
        break

# close camera and windows 
camera.release()
cv2.destroyAllWindows()

Wednesday, July 10, 2019

Python 3.7.3 : About python version 3.7.3.

All versions of python come with many features and changes with every released version.
A full list of these changes can be found at PEP official webpage and this documentation webpage.
The goal of these tutorials is to fix the learning area by each python version and have a good picture of these features.
Let's start with the first step - python modules.
Several of the standard library Python packages have been reorganized or moved with a few notable changes:
C:\Python373>python.exe
Python 3.7.3 (v3.7.3:ef4ec6ed12, Mar 25 2019, 21:26:53) [MSC v.1916 32 bit (Inte
l)] on win32
Type "help", "copyright", "credits" or "license" for more information.
>>> import pickle
>>> import profile
>>> import urllib
>>> import urllib3
The division math operation has new features to explicitly convert integers to floats when working with integer variables:
>>> one = 1
>>> two = 2
>>> three = 3
>>> float(three)
3.0
>>> one/two
0.5
>>> one//three
0
>>> one//two
0
>>> float(one)/three
0.3333333333333333
>>>
You can use the pathlib library which provides the Path() object to fulfill all your path manipulation needs.
>>> from pathlib import Path
>>> folder1 = Path('/folder1')
>>> config_path = folder1 / 'subfolder1'
>>> config_path
WindowsPath('/folder1/subfolder1')
>>> str(config_path)
'\\folder1\\subfolder1'
>>> config_path.name
'subfolder1'
You can use operators with matrix:
>>> import numpy as np
>>> x = np.array([[11, 33], [22, 55]])
>>> y = np.array([[1, 3], [2, 5]])
>>> x @ y
array([[ 77, 198],
       [132, 341]])
>>> x * y
array([[ 11,  99],
       [ 44, 275]])
The list and dictionaries can easily be emptied using the .clear method:
>>> my_list = ['a','b','c']
>>> my_list.clear()
The print function is changed.
>>> print('hello')
hello
>>> a = ''
>>> f = open('my_file.txt', 'w')
>>> print(a, file=f)
>>> f.close()
The function annotations can provide information on inputs/outputs:
>>> def a_to_b(x: str) -> str:
...     return x.replace('a','b')
...
>>> a_to_b("abcdcba!?!")
'bbcdcbb!?!'
Fix the sensible comparison:
>>> 'True' > True
Traceback (most recent call last):
  File "", line 1, in 
TypeError: '>' not supported between instances of 'str' and 'bool'
With Python 3.6 we have a new type of strings: f-strings and string interpolation:
>>> var = 76/3
>>> f'The value is {var}.'
'The value is 25.333333333333332.'
You can use underscores in numbers:
>>> int_a = 1_000_000_000
>>> hex_b = 0b_0011_1111_0100_1110
>>> print(int_a,hex_b)
1000000000 16206
The new Unicode strings and variable (including emoji) names to be used.
An LRU cache decorator for your functions: functools.lru_cache.
An enumerated type in the standard library: Enum.
Use the standard ipaddress:
>>> import ipaddress
>>> ipaddress.ip_address('192.168.0.1')
IPv4Address('192.168.0.1')
>>> ipaddress.ip_address('2001:db8::')
IPv6Address('2001:db8::')
In Python 3, decimals are rounded to the nearest even number (.5).
The input() function was fixed in Python 3 so that it always stores the user inputs as str objects.
In Python 3, the range() was implemented like the xrange() in older version.
That range got a new __contains__ method in Python 3.x.
You can simply convert the iterable object into a list via the list() function.
>>> print(range(3))
range(0, 3)
>>> print(type(range(3)))

>>> print(list(range(3)))
[0, 1, 2]
With advanced unpacking and range you can do this:
>>> a, b = range(2)
>>> print(a,b)
0 1
>>> a, b, *rest = range(6)
>>> print(a,b)
0 1
>>> print(rest)
[2, 3, 4, 5]
>>> a, *rest, b = range(6)
>>> print( a,b, rest)
0 5 [1, 2, 3, 4]
Get the first and the last of the open file with:
first, *_, last = f.readlines()
Keyword only arguments can be done with:
def f(a, b, *args, option=True):
The only way to access it is to explicitly call f(a, b, option=True).
If you don't want to collect *args the use this:
def f(a, b, *, option=True):
You can just use os.stat(file, follow_symlinks=False) instead of os.lstat.
The next function can be call only into this way:
>>> my_generator = (letter for letter in 'abcd')
>>> next(my_generator)
'a'
>>> next(my_generator)
'b'
The for-loop variables don’t leak into the global namespace anymore:
>>> i = 1
>>> print('comprehension:', [i for i in range(6)])
comprehension: [0, 1, 2, 3, 4, 5]
>>> print('i is ', i)
i is  1
The async and await are now reserved keywords.
More useful exceptions and also change the comma with the keyword as:
>>> try:
...     f = open('my_file.txt')
... except OSError as e:
...     if e.errno == errno.ENOENT:
...             #

...     else:

...     raise 
In Python 3, the .keys() method instead returns an iterator object instead of a list.
>>> my_dict = {'a': 11, 'b': 12, 'c': 13, 'd': 14}
>>> my_dict.keys()
dict_keys(['a', 'b', 'c', 'd'])
>>> my_dict_keys=list(my_dict.keys())
>>> my_dict_keys[3]
'd'
>>> my_dict.keys()[3]
Traceback (most recent call last):
  File "", line 1, in 
TypeError: 'dict_keys' object is not subscriptable
Keyword-only arguments and positional parameters are valid in Python 3.7.3.
The chained Exceptions provide by python 3.7.3 has more information and the original exception is printed out, along with the original traceback.
>>> raise exception from e
Traceback (most recent call last):
  File "", line 1, in 
NameError: name 'exception' is not defined
>>> raise NotImplementedError from OSError
OSError

The above exception was the direct cause of the following exception:

Traceback (most recent call last):
  File "", line 1, in 
NotImplementedError
These were briefly some information about python 3.7.3 that might be of use to you.


Monday, April 15, 2019

Using the ORB feature from OpenCV python module.

Today I will show you a simple script using the ORB (oriented BRIEF), see C++ documentation / OpenCV.
The algorithm uses FAST in pyramids to detect stable keypoints, selects the strongest features using FAST or Harris response, finds their orientation using first-order moments and computes the descriptors using BRIEF (where the coordinates of random point pairs (or k-tuples) are rotated according to the measured orientation).
One good feature of ORB is the is rotation invariant and resistant to noise.
The ORB descriptor use the Center of the mass of the patch of the Moment (sum of x,y), Centroid (the result of the matrix of all moment) and Orientation ( the atan2 of moment one and two).
One good article about ORB can be found here.
Let's see the script code of this python example:
import cv2
import numpy as np 

image_1 = cv2.imread("1.png", cv2.IMREAD_GRAYSCALE)
image_2 = cv2.imread("2.png", cv2.IMREAD_GRAYSCALE)

orb = cv2.ORB_create()
kp1, des1 = orb.detectAndCompute(image_1,None)
kp2, des2 = orb.detectAndCompute(image_2,None)

bf = cv2.BFMatcher(cv2.NORM_HAMMING, crossCheck=True)
matches = bf.match(des1, des2)
matches = sorted(matches, key = lambda x:x.distance)

matching_result = cv2.drawMatches(image_1, kp1, image_2, kp2, matches[:150], None, flags=2)

cv2.imshow("Image 1", image_1)
cv2.imshow("Image 2", image_2)
cv2.imshow("Matching result", matching_result)
cv2.waitKey(0)
cv2.destroyAllWindows()
The script use two file images 1.png and 2.png.
The result is an image composed of the two on which the areas of similitude are traced as detected by the mathematical algorithm.

Sunday, March 11, 2018

Python 3.6.4 : Testing OpenCV default GrabCut algorithm.

The main goal for me was to test the new install of python 3.6.4 and python modules with Windows operating system version 8.1.
For this tutorial, I chose these python modules: cv2, numpy and matplotlib .
I have tested the GrabCut algorithm article from here.
The article comes with a python script that includes the modules I tested in this programming language.
They tell us:
User inputs the rectangle. Everything outside this rectangle will be taken as sure background (That is the reason it is mentioned before that your rectangle should include all the objects). Everything inside rectangle is unknown. Similarly any user input specifying foreground and background are considered as hard-labelling which means they won't change in the process.
From my point of view, it is not a very successful algorithm to crop off the background but is working well.
import numpy as np
import cv2
from matplotlib import pyplot as plt

img = cv2.imread('test_python_opencv.jpg')
mask = np.zeros(img.shape[:2],np.uint8)

bgdModel = np.zeros((1,65),np.float64)
fgdModel = np.zeros((1,65),np.float64)

rect = (57,58,476,741)
cv2.grabCut(img,mask,rect,bgdModel,fgdModel,5,cv2.GC_INIT_WITH_RECT)

mask2 = np.where((mask==2)|(mask==0),0,1).astype('uint8')
img = img*mask2[:,:,np.newaxis]

plt.imshow(img),plt.colorbar(),plt.show()
The intersection areas are eliminated exactly as in the documentation.
See my first test on an image taken from the internet.

Sunday, December 11, 2016

The morse python module with pip installation versus precompiled archive wheel.

Today I try to deal with morse python module and it took me a while to install python modules because of their dependencies.
I started with the pip install of morse module but I got dependency errors in python modules
Because I try to fix this issue the result of this tutorial is more about how to install some python module: matplotlib, scipy, numpy, mkl and morse.
The all installation process will help you to understand how can be fix some pip installation versus precompiled archive wheel.
C:\Python27\Scripts>pip install matplotlib
Collecting matplotlib
  Downloading matplotlib-1.5.3-cp27-cp27m-win32.whl (6.0MB)
    100% |################################| 6.0MB 98kB/s
Requirement already satisfied: numpy>=1.6 in c:\python27\lib\site-packages (from
 matplotlib)
Collecting python-dateutil (from matplotlib)
  Downloading python_dateutil-2.6.0-py2.py3-none-any.whl (194kB)
    100% |################################| 194kB 1.4MB/s
Collecting cycler (from matplotlib)
  Downloading cycler-0.10.0-py2.py3-none-any.whl
Collecting pyparsing!=2.0.4,!=2.1.2,>=1.5.6 (from matplotlib)
  Downloading pyparsing-2.1.10-py2.py3-none-any.whl (56kB)
    100% |################################| 61kB 2.0MB/s
Collecting pytz (from matplotlib)
  Downloading pytz-2016.10-py2.py3-none-any.whl (483kB)
    100% |################################| 491kB 656kB/s
Collecting six>=1.5 (from python-dateutil->matplotlib)
  Downloading six-1.10.0-py2.py3-none-any.whl
Installing collected packages: six, python-dateutil, cycler, pyparsing, pytz, ma
tplotlib
Successfully installed cycler-0.10.0 matplotlib-1.5.3 pyparsing-2.1.10 python-da
teutil-2.6.0 pytz-2016.10 six-1.10.0

Download SciPy wheel file from here.
Install this file with:
C:\Python27\Scripts>pip install scipy-0.18.1-cp27-cp27m-win32.whl
Processing c:\python27\scripts\scipy-0.18.1-cp27-cp27m-win32.whl
Installing collected packages: scipy
Successfully installed scipy-0.18.1

Now you can install morse pyhon module.
pip install morse
If you installed the numpy by pip, but the scipy was installed by precompiled archive then expects numpy+mkl.
So to fix that issue, I download the numpy-1.12.0b1+mkl-cp27-cp27m-win32.whl file and install this with pip:
C:\Python27\Scripts>pip install "numpy-1.12.0b1+mkl-cp27-cp27m-win32.whl"
Processing c:\python27\scripts\numpy-1.12.0b1+mkl-cp27-cp27m-win32.whl
Installing collected packages: numpy
Found existing installation: numpy 1.11.2
Uninstalling numpy-1.11.2:
Successfully uninstalled numpy-1.11.2
Successfully installed numpy-1.12.0b1+mkl

Let's test the morse python module.
C:\Python27>python
Python 2.7.12 (v2.7.12:d33e0cf91556, Jun 27 2016, 15:19:22) [MSC v.1500 32 bit (
Intel)] on win32
Type "help", "copyright", "credits" or "license" for more information.
>>> import morse
>>> dir(morse)
['__builtins__', '__doc__', '__file__', '__name__', '__package__', 'lookup', 'st
ring_to_morse']
>>> dir(morse.lookup)
['__class__', '__cmp__', '__contains__', '__delattr__', '__delitem__', '__doc__'
, '__eq__', '__format__', '__ge__', '__getattribute__', '__getitem__', '__gt__',
'__hash__', '__init__', '__iter__', '__le__', '__len__', '__lt__', '__ne__', '_
_new__', '__reduce__', '__reduce_ex__', '__repr__', '__setattr__', '__setitem__'
, '__sizeof__', '__str__', '__subclasshook__', 'clear', 'copy', 'fromkeys', 'get
', 'has_key', 'items', 'iteritems', 'iterkeys', 'itervalues', 'keys', 'pop', 'po
pitem', 'setdefault', 'update', 'values', 'viewitems', 'viewkeys', 'viewvalues']
>>> print morse.lookup.keys()
['"', '$', '&', '(', ',', '.', '0', '2', '4', '6', '8', ':', '@', 'B', 'D', 'F',
'H', 'J', 'L', 'N', 'P', 'R', 'T', 'V', 'X', 'Z', '!', "'", ')', '+', '-', '/',
'1', '3', '5', '7', '9', ';', '=', '?', 'A', 'C', 'E', 'G', 'I', 'K', 'M', 'O',
'Q', 'S', 'U', 'W', 'Y', '_']
>>> print morse.lookup.items()
[('"', '.-..-.'), ('$', '...-..-'), ('&', '.-...'), ('(', '-.--.'), (',', '--..-
-'), ('.', '.-.-.-'), ('0', '-----'), ('2', '..---'), ('4', '....-'), ('6', '-..
..'), ('8', '---..'), (':', '---...'), ('@', '.--.-.'), ('B', '-...'), ('D', '-.
.'), ('F', '..-.'), ('H', '....'), ('J', '.---'), ('L', '.-..'), ('N', '-.'), ('
P', '.--.'), ('R', '.-.'), ('T', '-'), ('V', '...-'), ('X', '-..-'), ('Z', '--..
'), ('!', '-.-.--'), ("'", '.----.'), (')', '-.--.-'), ('+', '.-.-.'), ('-', '-.
...-'), ('/', '-..-.'), ('1', '.----'), ('3', '...--'), ('5', '.....'), ('7', '-
-...'), ('9', '----.'), (';', '-.-.-.'), ('=', '-...-'), ('?', '..--..'), ('A',
'.-'), ('C', '-.-.'), ('E', '.'), ('G', '--.'), ('I', '..'), ('K', '-.-'), ('M',
'--'), ('O', '---'), ('Q', '--.-'), ('S', '...'), ('U', '..-'), ('W', '.--'), (
'Y', '-.--'), ('_', '..--.-')]

You can see the python morse module is working well.

Wednesday, November 30, 2016

OpenGL and OpenCV with python 2.7 - part 004.

Today I will continue the series of graphics processing in OpenGL and OpenCV.
The goal of this tutorial is the download and load into the python script of a youtube video.
To do that we need another two modules python.
First, I download and install the python 2.7.12 32 bit version from the internet.
C:\Python27>python.exe
Python 2.7.12 (v2.7.12:d33e0cf91556, Jun 27 2016, 15:19:22) [MSC v.1500 32 bit (
Intel)] on win32
Type "help", "copyright", "credits" or "license" for more information.

First update the pip tool and install numpy python module:
C:\Python27\Scripts>python -m pip install --upgrade pip
Collecting pip
Downloading pip-9.0.1-py2.py3-none-any.whl (1.3MB)
100% |################################| 1.3MB 419kB/s
Installing collected packages: pip
Found existing installation: pip 8.1.1
Uninstalling pip-8.1.1:
Successfully uninstalled pip-8.1.1
Successfully installed pip-9.0.1
C:\Python27\Scripts>pip install numpy
Collecting numpy
Downloading numpy-1.11.2-cp27-none-win32.whl (6.5MB)
100% |################################| 6.5MB 79kB/s
Installing collected packages: numpy
Successfully installed numpy-1.11.2

The main reason to have the numpy python module: it is often used with OpenCV python module.
For OpenCV python module installation you need to see my tutorial.
After you install it, test the OpenCV python module:
C:\Python27>python.exe
Python 2.7.12 (v2.7.12:d33e0cf91556, Jun 27 2016, 15:19:22) [MSC v.1500 32 bit (
Intel)] on win32
Type "help", "copyright", "credits" or "license" for more information.
>>> import cv2
>>> print cv2.__version__
3.0.0

Install pafy python module.
This module help you to download video from youtube but you need also the youtube-dl python module.
So let's install the youtube-dl and pafy python modules.
C:\Python27>cd Scripts
C:\Python27\Scripts>pip install youtube-dl
Collecting youtube-dl
Downloading youtube_dl-2016.12.1-py2.py3-none-any.whl (1.5MB)
100% |################################| 1.5MB 377kB/s
Installing collected packages: youtube-dl
Successfully installed youtube-dl-2016.12.1
C:\Python27\Scripts>pip install pafy
Collecting pafy
Downloading pafy-0.5.2-py2.py3-none-any.whl
Installing collected packages: pafy
Successfully installed pafy-0.5.2

I make a simple python script named: get_yt.py.
The source code of this script is simple:
import os
import pafy
# Download the video
video = pafy.new('https://www.youtube.com/watch?v=O5VCjktWVD4')
print "video.title"
print video.title
print "video.rating"
print video.rating
print "video.viewcount, video.author, video.length"
print video.viewcount, video.author, video.length
print "video.duration, video.likes, video.dislikes"
print video.duration, video.likes, video.dislikes
print "video.description"
print video.description
resolution = video.getbestvideo(preftype="mp4")
print "resolution"
print resolution
input_movie = resolution.download(quiet=False)
print "input_movie"
print input_movie
print "delete movie"
os.remove(input_movie)

I used the URL of a video clip from youtube channel of Arden Cho to tested.
If you want to keep the video into your folder just remove the last line from the python script.
The result is this output:
C:\Python27>python.exe get_yt.py
video.title
Can't Help Falling in Love With You - Arden Cho
video.rating
4.99041318893
video.viewcount, video.author, video.length
10980 ardenBcho 168
video.duration, video.likes, video.dislikes
00:02:48 1665 4
video.description
Recorded this song a couple months ago when I was in Boston, this song always reminds
me of holidays and love so sharing that with you!

Guitar by Koo Chung https://youtube.com/koochung
Violin and Video editing/production by Daniel Jang https://www.youtube.com/metal
sides
Production + Keys by Tim Bongiovanni https://www.northgateproductions.net
Filmed by Rob Mark https://www.instagram.com/rmarq_

If you like my music comment and SHARE! You can also support me by buying & rati
ng my album on iTunes!! https://itunes.apple.com/us/album/my-true-happy/id592588
859

You can follow me at: SnapChat: ardencho
http://www.instagram.com/arden_cho
http://www.facebook.com/hiardencho
http://www.twitter.com/arden_cho
http://www.imdb.me/ardencho
resolution
video:mp4@1920x1080
input_movie5 Bytes [100.00%] received. Rate: [5371 KB/s]. ETA: [0 secs]
Can't Help Falling in Love With You - Arden Cho.mp4
delete movie


Thursday, September 8, 2016

OpenGL and OpenCV with python 2.7 - part 003.

If you have seen the last tutorial about OpenCV, then this tutorial comes to complete with one source code.
This source code will cut the background of webcam.
The webcam output is take by VideoCapture function.
This part of source code: np.zeros((1,65),np.float64) will return a new array of given shape and type, filled with zeros.
The result of this parts is used with function grabCut from cv2 python module.
This is the source code:

import numpy as np
import cv2
cap = cv2.VideoCapture(0)
while(True):
    ret, img = cap.read()
    #img = cv2.imread('test002.jpg')
    mask = np.zeros(img.shape[:2],np.uint8)

    bgdModel = np.zeros((1,65),np.float64)
    fgdModel = np.zeros((1,65),np.float64)

    rect = (50,50,450,290)
    cv2.grabCut(img,mask,rect,bgdModel,fgdModel,5,cv2.GC_INIT_WITH_RECT)

    mask2 = np.where((mask==2)|(mask==0),0,1).astype('uint8')
    img = img*mask2[:,:,np.newaxis]
    cv2.imshow('frame',img)
    if 0xFF & cv2.waitKey(5) == 27:
        break
cap.release()
cv2.destroyAllWindows()
The end result will be something like:

Saturday, June 25, 2016

OpenGL and OpenCV with python 2.7 - part 002.

I deal today with opencv and I fix some of my errors.
One is this error I got with cv2.VideoCapture. When I  try to used with load video and createBackgroundSubtractorMOG2() i got this:

cv2.error:   C:\builds\master_PackSlaveAddon-win64-vc12-static\opencv\modules\highgui\src\window.cpp:281:  error: (-215) size.width<0 amp="" cv::imshow="" function="" i="" in="" size.height="">
You need also to have opencv_ffmpeg310.dll and opencv_ffmpeg310_64.dll into your Windows C:\Windows\System32, this will help me to play videos.
Now make sure you have the opencv version 3.1.0 because opencv come with some changes over python.
C:\Python27\python
Python 2.7.8 (default, Jun 30 2014, 16:08:48) [MSC v.1500 64 bit (AMD64)] on win32
Type "help", "copyright", "credits" or "license" for more information.
>>>import cv2
>>>print cv2.__version__
3.1.0

You can take some infos from about opencv python module - cv2 with:

>>>cv2.getBuildInformation()
...
>>>cv2.getCPUTickCount()
...
>>>print cv2.getNumberOfCPUs()
...
>>>print cv2.ocl.haveOpenCL()
True

You can also see some error by disable OpenCL:

>>>cv2.ocl.setUseOpenCL(False)
>>>print cv2.ocl.useOpenCL()
False

Now will show you how to use webcam gray and color , and play one video:
webcam color

import numpy as np
import cv2
cap = cv2.VideoCapture(0)
while(True):
    ret, frame = cap.read()
    cv2.imshow('frame',frame)
    if 0xFF & cv2.waitKey(5) == 27:
        break
cap.release()
cv2.destroyAllWindows()

webcam gray

import numpy as np
import cv2
cap = cv2.VideoCapture(0)
while(True):
    ret, frame = cap.read()
    gray = cv2.cvtColor(frame, cv2.COLOR_BGR2GRAY)
    cv2.imshow('frame',gray)
    if 0xFF & cv2.waitKey(5) == 27:
        break
cap.release()
cv2.destroyAllWindows()

play video

import cv2
from cv2 import *
capture = cv2.VideoCapture("avi_test_001.avi")
while True:
    ret, img = capture.read()
    cv2.imshow('some', img)
    if 0xFF & cv2.waitKey(5) == 27:
        break
cv2.destroyAllWindows()


Wednesday, June 22, 2016

OpenGL and OpenCV with python 2.7 - part 001.

First you need to know what version of python you use.
C:\Python27>python
Python 2.7.8 (default, Jun 30 2014, 16:08:48) [MSC v.1500 64 bit (AMD64)] on win32
Type "help", "copyright", "credits" or "license" for more information.
>>>

You need also to download the OpenCV version 3.0 from here.
Then run the executable into your folder and get cv2.pyd file from \opencv\build\python\2.7\x64 and paste to \Python27\Lib\site-packages.
If you use then use 32 bit python version then use this path: \opencv\build\python\2.7\x86.
Use pip to install next python modules:
C:\Python27\Scripts>pip install PyOpenGL
...
C:\Python27\Scripts>pip install numpy
...
C:\Python27\Scripts>pip install matplotlib
...

Let's see how is working OpenGL:
C:\Python27>python
Python 2.7.8 (default, Jun 30 2014, 16:08:48) [MSC v.1500 64 bit (AMD64)] on win32
Type "help", "copyright", "credits" or "license" for more information.
>>> import OpenGL
>>> import numpy
>>> import matplotlib
>>> import cv2
>>> from OpenGL import *
>>> from numpy import *
>>> from matplotlib import *
>>> from cv2 import *

You can also use dir(module) to see more. You can import all from GL, GLU and GLUT.
>>> dir(OpenGL)
['ALLOW_NUMPY_SCALARS', 'ARRAY_SIZE_CHECKING', 'CONTEXT_CHECKING', 'ERROR_CHECKING', 'ERROR_LOGGING', 'ERROR_ON_COPY', 'FORWARD_COMPATIBLE_ONLY', 'FULL_LOGGING', 'FormatHandler', 'MODULE_ANNOTATIONS', 'PlatformPlugin', 'SIZE_1_ARRAY_UNPACK', 'STORE_POINTERS', 'UNSIGNED_BYTE_IMAGES_AS_STRING', 'USE_ACCELERATE', 'WARN_ON_FORMAT_UNAVAILABLE', '__builtins__', '__doc__', '__file__', '__name__', '__package__', '__path__', '__version__', '_bi', 'environ_key', 'os', 'plugins', 'sys', 'version']
>>> from OpenGL.GL import *
>>> from OpenGL.GLU import *
>>> from OpenGL.GLUT import *
>>> from OpenGL.WGL import *

If you are very good with python OpenGL module then you can import just like this example:
>>> from OpenGL.arrays import ArrayDatatype
>>> from OpenGL.GL import (GL_ARRAY_BUFFER, GL_COLOR_BUFFER_BIT,
... GL_COMPILE_STATUS, GL_FALSE, GL_FLOAT, GL_FRAGMENT_SHADER,
... GL_LINK_STATUS, GL_RENDERER, GL_SHADING_LANGUAGE_VERSION,
... GL_STATIC_DRAW, GL_TRIANGLES, GL_TRUE, GL_VENDOR, GL_VERSION,
... GL_VERTEX_SHADER, glAttachShader, glBindBuffer, glBindVertexArray,
... glBufferData, glClear, glClearColor, glCompileShader,
... glCreateProgram, glCreateShader, glDeleteProgram,
... glDeleteShader, glDrawArrays, glEnableVertexAttribArray,
... glGenBuffers, glGenVertexArrays, glGetAttribLocation,
... glGetProgramInfoLog, glGetProgramiv, glGetShaderInfoLog,
... glGetShaderiv, glGetString, glGetUniformLocation, glLinkProgram,
... glShaderSource, glUseProgram, glVertexAttribPointer)

Most of this OpenGL need to have a valid OpenGL rendering context.
For example you can test it with WGL ( WGL or Wiggle is an API between OpenGL and the windowing system interface of Microsoft Windows):
>>> import OpenGL
>>> from OpenGL import *
>>> from OpenGL import WGL
>>> print WGL.wglGetCurrentDC()
None

Now , let's see the OpenCV python module with s=one simple webcam python script:
import numpy as np
import cv2
cap = cv2.VideoCapture(0)
while(True):
    ret, frame = cap.read()
    gray = cv2.cvtColor(frame, cv2.COLOR_BGR2GRAY)
    cv2.imshow('frame',gray)
    if cv2.waitKey(1) & 0xFF == ord('q'):
        break
cap.release()
cv2.destroyAllWindows()
This is result of my webcam: