Today, I will show you how to have a more complex custom application with PyQt5 and QML file.
You need to create into your python folder a new folder named
QMLCustom.
Into this file create two python files named:
__init__.py and QMLCustom.py.
The
__init__ will be an empty file.
Into your python folder installation (where you create the QMLCustom folder), create a new QML_custom.qml file.
The QML_custom.qml file will have this:
import QtQuick 2.0
import SDK 1.0
import QtQuick.Layouts 1.1

Rectangle {
    id: appwnd
    visible: true
    width: 640
    height: 480

    property int columns : 2
    property int rows : 2

    Rectangle {
        anchors.fill: parent
        color: "#00f"
    }

    GridView {
        id: grid
        anchors.fill: parent
        cellWidth: Math.max(width/2, height/2);
        cellHeight: Math.max(width/2, height/2)
        model: dashModel
        delegate : Rectangle {
            Layout.alignment: Layout.Center
            width: grid.cellWidth
            height: grid.cellHeight
            color: "#0ff"
            border.color: "#fff"
            border.width: 10

            Text {
                id: name
                anchors.horizontalCenter: parent.horizontalCenter
                anchors.bottom: parent.bottom
                anchors.leftMargin:15
                anchors.topMargin: 15
                width: parent.width
                height: parent.height
                textFont {
                    family: "Halvetica"
                    italic: false
                    pointSize:20
                }
                suffixText: suffix
            }

        }
        onWidthChanged: {
            grid.cellWidth = grid.width/appwnd.columns;
        }

        onHeightChanged: {
            grid.cellHeight = grid.height/appwnd.rows
        }
    }

    ListModel {
        id: dashModel
        ListElement {
            tagName: "Text"
            suffix: "First text"
        }
        ListElement {
            tagName: "Text"
            suffix: "Next text"
        }
    }
}
If you read this you will see the qml type file has two imports and a text.
The imports are used to load it and the text file is used to describe what we need.
In this case is created a Rectangle, GridView and one ListModel with two ListElement.
All of this part will be a link to the QMLCustom.py file.
For example: follow the
suffixText from qml file
suffixText: suffix into
QMLCustom.py file (decorator
def suffixText(self, text)).
Into the QMLCustom folder you need to fill the QMLCustom.py with this:
import PyQt5
from PyQt5.QtCore import *
from PyQt5.QtGui import *
from PyQt5.QtWidgets import *
from PyQt5.QtCore import pyqtProperty, pyqtSignal, pyqtSlot
from PyQt5.QtQuick import QQuickPaintedItem, QQuickItem
from PyQt5.QtGui import QPainter
from PyQt5 import QtCore

class QMLCustom(QQuickPaintedItem):
    #
    class DialType():
        FullDial = 0
        MinToMax = 1
        NoDial = 2
    #
    sizeChanged = pyqtSignal()
    valueChanged = pyqtSignal()
    #
    backgroundColorChanged = pyqtSignal()
    #
    textColorChanged = pyqtSignal()
    suffixTextChanged = pyqtSignal()
    showTextChanged = pyqtSignal()
    textFontChanged = pyqtSignal()

    def __init__(self, parent=None):
        super(QMLCustom, self).__init__(parent)

        self.setWidth(100)
        self.setHeight(100)
        self.setSmooth(True)
        self.setAntialiasing(True)

        self._Size = 100
        self._DialWidth = 15
        self._SuffixText = ""
        self._BackgroundColor = Qt.transparent
        self._TextColor = QColor(0, 0, 0)
        self._ShowText = True
        self._TextFont = QFont()

    def paint(self, painter):
        painter.save()

        size = min(self.width(), self.height())
        self.setWidth(size)
        self.setHeight(size)
        rect = QRectF(0, 0, self.width(), self.height())
        painter.setRenderHint(QPainter.Antialiasing)

        painter.restore()

        painter.save()
        painter.setFont(self._TextFont)
        offset = self._DialWidth / 2
        if self._ShowText:
            painter.drawText(rect.adjusted(offset, offset, -offset, -offset), Qt.AlignCenter, self._SuffixText)
        else:
            painter.drawText(rect.adjusted(offset, offset, -offset, -offset), Qt.AlignCenter, self._SuffixText)
        painter.restore()

    @QtCore.pyqtProperty(str, notify=sizeChanged)
    def size(self):
        return self._Size

    @size.setter
    def size(self, size):
        if self._Size == size:
            return
        self._Size = size
        self.sizeChanged.emit()

    @QtCore.pyqtProperty(float, notify=valueChanged)
    def value(self):
        return self._Value

    @value.setter
    def value(self, value):
        if self._Value == value:
            return
        self._Value = value
        self.valueChanged.emit()


    @QtCore.pyqtProperty(QColor, notify=backgroundColorChanged)
    def backgroundColor(self):
        return self._BackgroundColor

    @backgroundColor.setter
    def backgroundColor(self, color):
        if self._BackgroundColor == color:
            return
        self._BackgroundColor = color
        self.backgroundColorChanged.emit()


    @QtCore.pyqtProperty(QColor, notify=textColorChanged)
    def textColor(self):
        return self._TextColor

    @textColor.setter
    def textColor(self, color):
        if self._TextColor == color:
            return
        self._TextColor = color
        self.textColorChanged.emit()

    @QtCore.pyqtProperty(str, notify=suffixTextChanged)
    def suffixText(self):
        return self._SuffixText

    @suffixText.setter
    def suffixText(self, text):
        if self._SuffixText == text:
            return
        self._SuffixText = text
        self.suffixTextChanged.emit()

    @QtCore.pyqtProperty(str, notify=showTextChanged)
    def showText(self):
        return self._ShowText

    @showText.setter
    def showText(self, show):
        if self._ShowText == show:
            return
        self._ShowText = show


    @QtCore.pyqtProperty(QFont, notify=textFontChanged)
    def textFont(self):
        return self._TextFont

    @textFont.setter
    def textFont(self, font):
        if self._TextFont == font:
            return
        self._TextFont = font
        self.textFontChanged.emit()
This is a base python module that allows you to use the qml file and show it into your application.
The QMLCustom.py use a class (with pyqtSignal and paint to link all data with decorators) to be used into your application.
This can be a little difficult to follow but if you deal with a tool like QtCreator editor you will understand how this integrated GUI layout and forms designer with this script.
The last part is more simple and is the application.
This script uses both the custom python module QMLCustom and the qml file.
Create a python file into your folder python installation fill with the next script and run it:
import sys
import os
import subprocess

from QMLCustom.QMLCustom import QMLCustom

from PyQt5.QtCore import QUrl, Qt, QObject, pyqtSignal, pyqtSlot
from PyQt5.QtGui import QGuiApplication, QCursor
from PyQt5.QtQuick import QQuickView
from PyQt5.QtQml import qmlRegisterType
from OpenGL import GLU

class App(QGuiApplication):
 def __init__(self, argv):
  super(App, self).__init__(argv)

if __name__ == '__main__':
 try:
  app = App(sys.argv)

  qmlRegisterType(QMLCustom, "SDK", 1,0, "Text")

  view = QQuickView()
  ctxt = view.rootContext()
  view.setSource(QUrl("QML_custom.qml"))
  view.show()
  ret = app.exec_()

 except Exception as e:
  print (e)
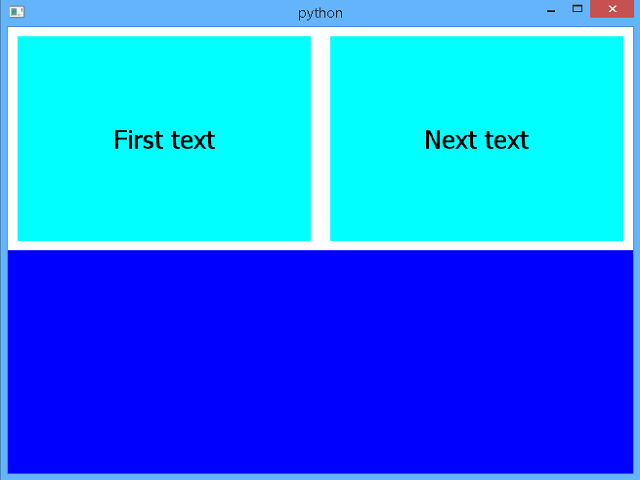
The result is this: