Today, I tested the python module named imdbpy with Colab Google features.
This show you how easy can build and run a simple python script to take data from web sites.
You can see the full example on my GitHub account.
Sunday, April 19, 2020
Python 3.8.2 : New release 2.3.2 for Pygame Menu.
Today, the development team come with this infos from the GitHub comes with a new release version 2.3.2.
Python library that can create a simple menu for the pygame application. Supports:
Let's start the tutorial with python install on Windows 10 using the installer from here.
Use these settings from images:


Download get-pip.py to a folder on your computer.
Open a command prompt and navigate to the folder containing get-pip.py.
Run the following command:
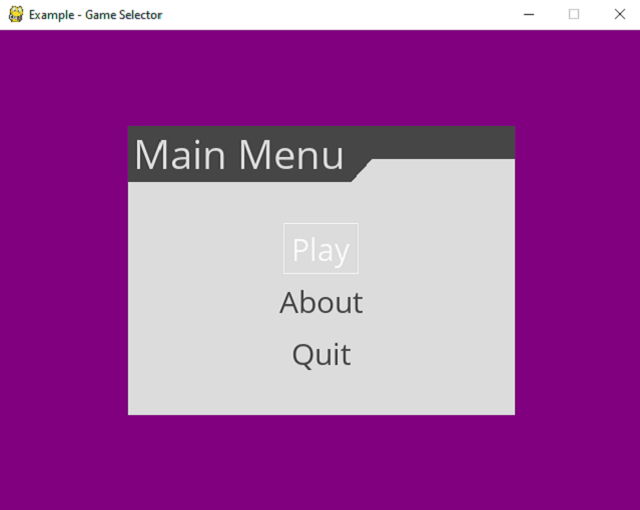
Python library that can create a simple menu for the pygame application. Supports:
- Textual menus
- Buttons
- Lists of values (selectors) that can trigger functions when pressing return or changing the value
- Input text
- Color input
Let's start the tutorial with python install on Windows 10 using the installer from here.
Use these settings from images:
Download get-pip.py to a folder on your computer.
Open a command prompt and navigate to the folder containing get-pip.py.
Run the following command:
python get-pip.pyC:\Projects\Python\pygame-menu>python -m pip install --upgrade pip
Collecting pip
Downloading https://files.pythonhosted.org/packages/54/0c/d01aa759fdc501a58f431
eb594a17495f15b88da142ce14b5845662c13f3/pip-20.0.2-py2.py3-none-any.whl (1.4MB)
|████████████████████████████████| 1.4MB 819kB/s
Installing collected packages: pip
Found existing installation: pip 19.2.3
Uninstalling pip-19.2.3:
Successfully uninstalled pip-19.2.3
Successfully installed pip-20.0.2C:\Projects\Python\pygame-menu>pip install pygame
Collecting pygame
Downloading pygame-1.9.6-cp38-cp38-win_amd64.whl (4.8 MB)
|████████████████████████████████| 4.8 MB 819 kB/s
Installing collected packages: pygame
Successfully installed pygame-1.9.6
$ git clone https://github.com/ppizarror/pygame-menu
Cloning into 'pygame-menu'...
remote: Enumerating objects: 9, done.
remote: Counting objects: 100% (9/9), done.
remote: Compressing objects: 100% (7/7), done.
remote: Total 5649 (delta 3), reused 7 (delta 2), pack-reused 5640
Receiving objects: 100% (5649/5649), 12.99 MiB | 5.52 MiB/s, done.
Resolving deltas: 100% (4289/4289), done.
...
C:\Projects\Python\pygame-menu>pip install -e .[doc]C:\Projects\Python\pygame-menu\pygame_menu\examples>python game_selector.py
pygame 1.9.6
Hello from the pygame community. https://www.pygame.org/contribute.html
...Saturday, April 4, 2020
Python 2.7.8 : Using python scripts with Revit Dynamo.
Dynamo is a visual programming tool that extends the power of the Revit by providing access to Revit API (Application Programming Interface.
Then from Main menu use Manage and click on Dynamo icon to open the Dynamo window and press on New project or Open an old project.
You can add node by typing in the left area named Library editbox the name o the node and click when is find it.
For example, type Watch and then double click to add to the work area.
Dynamo use Python version 2.7.8 and scripts works with python modules and Dynamo node.
For example, I add some node's to the working area and I link to see how these works using the click and drag mouse features.
If you want to test the python scripting issue, then use the editbox and type Python Script.
Use double click to add to working area.
Link the Python Script node with OUT with Watch, by click on OUT , drag with the mouse and then click on > input from Watch.
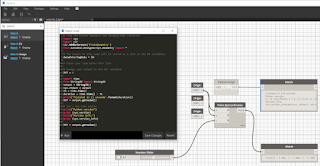
The script from the Python Script is this:
Dynamo works with node, each node have inputs and outputs and performs a specific task.
This is a short tutorial about how you can use your python skills with Revit and Dynamo software.
First, you need to start the Revit. I used Revit 2020 version.Then from Main menu use Manage and click on Dynamo icon to open the Dynamo window and press on New project or Open an old project.
You can add node by typing in the left area named Library editbox the name o the node and click when is find it.
For example, type Watch and then double click to add to the work area.
Dynamo use Python version 2.7.8 and scripts works with python modules and Dynamo node.
For example, I add some node's to the working area and I link to see how these works using the click and drag mouse features.
If you want to test the python scripting issue, then use the editbox and type Python Script.
Use double click to add to working area.
Search again the Watch node and add it.
To see the editor , use right click on Python Script and select the Edit... .
Now, you can have a image like this with an editor and a node named Python Script and a node named WatchLink the Python Script node with OUT with Watch, by click on OUT , drag with the mouse and then click on > input from Watch.
The script from the Python Script is this:
# Load the Python Standard and DesignScript Libraries
import sys
import clr
clr.AddReference('ProtoGeometry')
from Autodesk.DesignScript.Geometry import *

# The inputs to this node will be stored as a list in the IN variables.
dataEnteringNode = IN

# Place your code below this line

# Assign your output to the OUT variable.
OUT = 0

import time
from StringIO import StringIO
output = StringIO()
sys.stdout = output
t1 = time.time()
duration = time.time() - t1
print('Finished in {} seconds'.format(duration))
OUT = output.getvalue()

# let's the time module
print("Python version")
print (sys.version)
print("Version info.")
print (sys.version_info)

OUT = output.getvalue()Tuesday, March 17, 2020
Python 3.6.9 : My colab tutorials - part 003.
This tutorial refers to a python module named cirq.
The documentation of this python module can be found on this website.
The development team comes with this intro:
Cirq is a software library for writing, manipulating, and optimizing quantum circuits and then running them against quantum computers and simulators. Cirq attempts to expose the details of hardware, instead of abstracting them away, because, in the Noisy Intermediate-Scale Quantum (NISQ) regime, these details determine whether or not it is possible to execute a circuit at all.
I try to install on Ubuntu but not work:
See my GitHub account with the catafest_004.ipynb notebook example and basic pieces of information.
A very short intro into quantum computing area can be found on this video:
The documentation of this python module can be found on this website.
The development team comes with this intro:
Cirq is a software library for writing, manipulating, and optimizing quantum circuits and then running them against quantum computers and simulators. Cirq attempts to expose the details of hardware, instead of abstracting them away, because, in the Noisy Intermediate-Scale Quantum (NISQ) regime, these details determine whether or not it is possible to execute a circuit at all.
I try to install on Ubuntu but not work:
$ lsb_release -a
No LSB modules are available.
Distributor ID: Ubuntu
Description: Ubuntu 16.04.6 LTS
Release: 16.04
Codename: xenial
...
$ pip3 install cirq --user
Requirement already satisfied: cirq in ./.local/lib/python3.5/site-packages (0.5.556)
...
$ python3 -c 'import cirq; print(cirq.google.Foxtail)'
Traceback (most recent call last):
  File "", line 1, in
ImportError: No module named 'cirq' See my GitHub account with the catafest_004.ipynb notebook example and basic pieces of information.
A very short intro into quantum computing area can be found on this video:
Monday, March 16, 2020
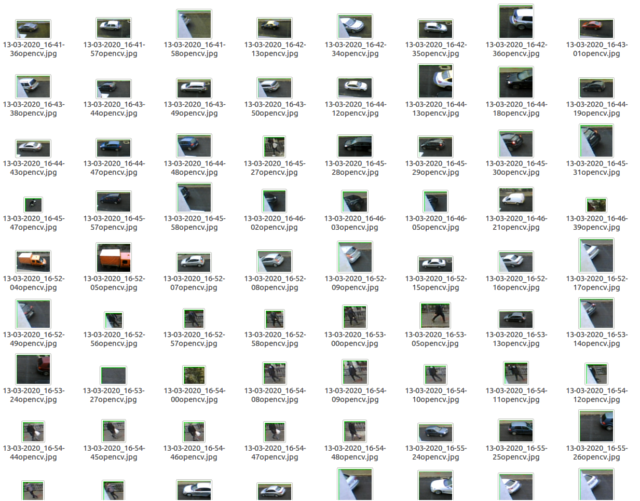
Python 3.5.2 : Detect motion and save images with opencv.
This script is simple to use it with a webcam or to parse a video file.
The main goal of this script is to see the difference in various frames of a video or webcam output.
The first frame of our video file will contain no motion and just background and then is compute the absolute difference.
There is no need to process the large, raw images straight from the video stream and this is the reason I convert the image to grayscale.
Some text is put on the window to show us the status string to indicate it is detection.
With this script I detect cars and peoples from my window, see the screenshot with these files:
Let's see the python script:
import argparse
import datetime
import imutils

import cv2

import time
from time import sleep

def saveJpgImage(frame):
    #process image
    img_name = "opencv_frame_{}.jpg".format(time)
    cv2.imwrite(img_name, frame)

def savePngImage():
    #process image
    img_name = "opencv_frame_{}.png".format(time)
    cv2.imwrite(img_name, frame)

# get argument parse
ap = argparse.ArgumentParser()
ap.add_argument("-v", "--video", help="path to the video file")
ap.add_argument("-s", "--size", type=int, default=480, help="minimum area size , default 480")
args = vars(ap.parse_args())

# if no video use webcam
if args.get("video", None) is None:
    camera = cv2.VideoCapture(0)
    #time.sleep(1.5)

# use video file
else:
    camera = cv2.VideoCapture(args["video"])


# frame from video is none
first_frame = None

# loop into frames of the video
while True:
    # grab the current frame
    (grabbed, frame) = camera.read()
    text = "undetected"

    # is no frame grabbed the is end of video
    if not grabbed:
        break

    # resize the frame
    frame = imutils.resize(frame, width=640)
    gray = cv2.cvtColor(frame, cv2.COLOR_BGR2GRAY)
    gray = cv2.GaussianBlur(gray, (21, 21), 0)

    # is first frame is none , make gray
    if first_frame is None:
        first_frame = gray
        continue


    # compute difference from current frame and first frame
    frameDelta = cv2.absdiff(first_frame, gray)
    first_frame = gray
    thresh = cv2.threshold(frameDelta, 1, 255, cv2.THRESH_BINARY)[1]

    # dilate the thresholded image to fill in holes
    # then find contours on thresholded image
    thresh = cv2.dilate(thresh, None, iterations=2)
    (cnts, _) = cv2.findContours(thresh.copy(), cv2.RETR_EXTERNAL,
                                 cv2.CHAIN_APPROX_SIMPLE)

    # loop contours
    for c in cnts:
        # if the contour is too small, ignore it
        if cv2.contourArea(c) < args["size"]:
            continue

        # compute the bounding box for the contour
        # draw it on the frame,
        # and update the text
        (x, y, w, h) = cv2.boundingRect(c)
        cv2.rectangle(frame, (x, y), (x + w, y + h), (0, 255, 0), 0)
        roi = frame[y:y+h, x:x+w]
        ts = time.time()
        st = datetime.datetime.fromtimestamp(ts).strftime('%d-%m-%Y_%H-%M-%S')
        # if the detection is on sized then save the image
        if (w > h ) and (y + h) > 50 and (y + h) < 550:
            cv2.imwrite(st+"opencv.jpg", roi)
        # set text to show on gui
        text = "detected"

    # draw the text and timestamp on the frame
    cv2.putText(frame, "Detect: {}".format(text), (10, 20),
                cv2.FONT_HERSHEY_SIMPLEX, 0.5, (0, 0, 255), 2)
    cv2.putText(frame, datetime.datetime.now().strftime("%A %d %B %Y %I:%M:%S%p"),
                (10, frame.shape[0] - 10), cv2.FONT_HERSHEY_SIMPLEX, 0.35, (0, 0, 255), 1)

    #show frame , thresh and frame_Delta
    cv2.imshow("Security Feed", frame)
    cv2.imshow("Thresh", thresh)
    cv2.imshow("Frame Delta", frameDelta)
    key = cv2.waitKey(1) &  0xFF

    # break from loop with q key
    if key == ord("q"):
        break

# close camera and windows
camera.release()
cv2.destroyAllWindows()Wednesday, March 4, 2020
Python 3.6.9 : My colab tutorials - part 002.
This is another notebook with the Altair python package.
The development team comes with this intro:
Altair is a declarative statistical visualization library for Python, based on Vega and Vega-Lite.
Altair offers a powerful and concise visualization grammar that enables you to build a wide range of statistical visualizations quickly. Here is an example of using the Altair API to quickly visualize a dataset with an interactive scatter plot:
See the notebook at my GitHub account.
Sunday, March 1, 2020
Python 3.6.9 : My colab tutorials - part 001.
Today I start this tutorials series for the Colab tool.
To share my working with the Colab tool I created this GitHub project.
This project has two colab files :
The next colab notebook is a little bit more complex and shares more information about how can deal with simples tasks on colab.
This is the table of contests for this colab notebook:
To share my working with the Colab tool I created this GitHub project.
This project has two colab files :
catafest_001.ipynb  Created using Colaboratory
catafest_002.ipynb Created using Colaboratory The next colab notebook is a little bit more complex and shares more information about how can deal with simples tasks on colab.
This is the table of contests for this colab notebook:
- Table of contents
- Select GPU for this notebook
- Check with nvidia-smi
- Check whether you have a visible GPU
- Check with tensoflow test
- Read information about hardware
- Check cpuinfo
- Check meminfo
- Use Linux commands
- Use python modules torch and fastai
- Use python modules
- Show and get information
- Enter credentials with Username and Password:
- Datatime fields
- Raw fields
- Number fields
- Boolean fields
- Pandas data fields
- Upload files
- Upload local files
- Use the Jupyter Widgets
Python Qt5 : Create a spectrum equalizer.
I haven't written much for a while on these issues about python and PyQt5.
Today I will show a complex example of QtMultimedia and how to create a spectrum equalizer.
First, the PyQt5 bindings come with this python module named QtMultimedia.
The main reason was the lack of time and focus of my effort on more stringent elements of my life.
Let's start with the few lines of source code that show us how can use this python module.
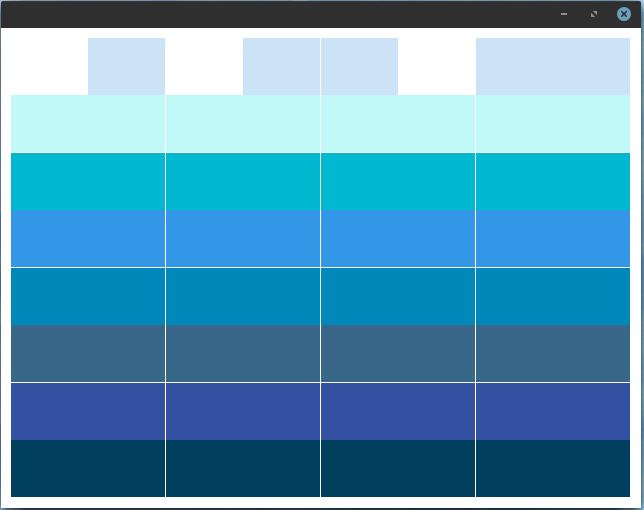
This source doesn't use the QtMultimedia but can be implemented in the random area of equalizer set by update_values function:
Today I will show a complex example of QtMultimedia and how to create a spectrum equalizer.
First, the PyQt5 bindings come with this python module named QtMultimedia.
The main reason was the lack of time and focus of my effort on more stringent elements of my life.
Let's start with the few lines of source code that show us how can use this python module.
[mythcat@desk ~]$ python3
Python 3.7.6 (default, Jan 30 2020, 09:44:41)
[GCC 9.2.1 20190827 (Red Hat 9.2.1-1)] on linux
Type "help", "copyright", "credits" or "license" for more information.
>>> import PyQt5
>>> from PyQt5.QtMultimedia import *
>>> dir(PyQt5.QtMultimedia)
['QAbstractVideoBuffer', 'QAbstractVideoFilter', 'QAbstractVideoSurface', 'QAudio', 'QAudioBuffer',
 'QAudioDecoder', 'QAudioDeviceInfo', 'QAudioEncoderSettings', 'QAudioFormat', 'QAudioInput', 'QAudioOutput',
 'QAudioProbe', 'QAudioRecorder', 'QCamera', 'QCameraExposure', 'QCameraFocus', 'QCameraFocusZone',
 'QCameraImageCapture', 'QCameraImageProcessing', 'QCameraInfo', 'QCameraViewfinderSettings',
 'QImageEncoderSettings','QMediaBindableInterface', 'QMediaContent', 'QMediaControl', 'QMediaMetaData',
 'QMediaObject', 'QMediaPlayer', 'QMediaPlaylist', 'QMediaRecorder', 'QMediaResource', 'QMediaService',
 'QMediaTimeInterval', 'QMediaTimeRange', 'QMultimedia', 'QRadioData', 'QRadioTuner', 'QSound', 'QSoundEffect',
 'QVideoEncoderSettings', 'QVideoFilterRunnable', 'QVideoFrame', 'QVideoProbe', 'QVideoSurfaceFormat',
'__doc__', '__file__', '__loader__', '__name__', '__package__', '__spec__']This source doesn't use the QtMultimedia but can be implemented in the random area of equalizer set by update_values function:
import random
import sys
from PyQt5 import QtCore, QtGui, QtWidgets
from PyQt5.QtCore import Qt
from PyQt5.QtCore import pyqtSignal as Signal

print("load all modules!")

class Equalizer_Bars(QtWidgets.QWidget):

    def __init__(self, bars, steps, *args, **kwargs):
        super().__init__(*args, **kwargs)
        # this fit the size to equalizer bars area
        self.setSizePolicy(
            QtWidgets.QSizePolicy.MinimumExpanding,
            QtWidgets.QSizePolicy.MinimumExpanding
        )
        # set the size of the window
        self.setMinimumHeight(480)
        self.setMinimumWidth(640)

        if isinstance(steps, list):
            # list of colours.
            self.n_steps = len(steps)
            self.steps = steps

        elif isinstance(steps, int):
            # int number of bars, defaults to blue.
            self.n_steps = steps
            self.steps = ['blue'] * steps
        else:
            raise TypeError('steps variable set wrong, try with a list or int')

        # create bars
        self.set_bars = bars
        # define settings of bars
        self.set_space_between_bars = 1
        self.set_height_of_bars = 1
        # set color of background
        self.set_background_color = QtGui.QColor('white')
        # set padding by pixel .
        self.set_padding = 10

        # create timer
        self.set_timer = None
        # set decay for move bars
        self.set_decay_frequency_ms(76)
        self.set_decay_value= 10

        # set values for minim and maxim
        self.set_min_value = 0
        self.set_max_value = 100

        # store all current values in a list.
        self.set_all_values= [0.0] * bars


    def paintEvent(self, e):
        # create a painter
        painter = QtGui.QPainter(self)
        # create a brush for drawing
        brush = QtGui.QBrush()
        brush.setColor(self.set_background_color)
        brush.setStyle(Qt.SolidPattern)
        rect = QtCore.QRect(0, 0, painter.device().width(), painter.device().height())
        painter.fillRect(rect, brush)

        # set the canvas.
        d_height = painter.device().height() - (self.set_padding * 2)
        d_width = painter.device().width() - (self.set_padding * 2)

        # set the bars.
        step_y = d_height / self.n_steps
        bar_height = step_y * self.set_height_of_bars
        bar_height_space = step_y * (1 - self.set_space_between_bars) / 2

        step_x = d_width / self.set_bars
        bar_width = step_x * self.set_space_between_bars
        bar_width_space = step_x * (1 - self.set_height_of_bars) / 2

        for i in range(self.set_bars):

            # calculating the y position for this bar for stop, from the value in range.
            c = (self.set_all_values[i] - self.set_min_value) / (self.set_max_value - self.set_min_value)
            n_steps_to_draw = int(c * self.n_steps)

            for n in range(n_steps_to_draw):
                brush.setColor(QtGui.QColor(self.steps[n]))
                rect = QtCore.QRect(
                    self.set_padding + (step_x * i) + bar_width_space,
                    self.set_padding + d_height - ((1 + n) * step_y) + bar_height_space,
                    bar_width,
                    bar_height
                )
                painter.fillRect(rect, brush)

        painter.end()

    def _trigger_refresh(self):
        self.update()

    def set_decay_trick(self, f):
        self.set_decay_value= float(f)

    def set_decay_frequency_ms(self, ms):
        if self.set_timer:
            self.set_timer.stop()

        if ms:
            self.set_timer = QtCore.QTimer()
            self.set_timer.setInterval(ms)
            self.set_timer.timeout.connect(self.set_decay_beat)
            self.set_timer.start()

    def set_decay_beat(self):
        self.set_all_values= [
            max(0, v - self.set_decay_value)
            for v in self.set_all_values
        ]
        self.update()  # Redraw new position.

    def size_values(self, v):
        self.set_all_values= v
        self.update()

    def values(self):
        return self.set_all_values

    def set_range(self, vmin, vmax):
        assert float(vmin) < float(vmax)
        self.set_min_value, self.set_max_value = float(vmin), float(vmax)
    # will be used with QBrush
    def setColor(self, color):
        self.steps = [color] * self._bar.n_steps
        self.update()

    def set_color_bars(self, colors):
        self.n_steps = len(colors)
        self.steps = colors
        self.update()

    def set_bar_padding(self, i):
        self.set_padding = int(i)
        self.update()

    def set_bar_solid_percent(self, f):
        self._bar_solid_percent = float(f)
        self.update()

    def set_background_color(self, color):
        self.set_background_color = QtGui.QColor(color)
        self.update()


class Window(QtWidgets.QMainWindow):

    def __init__(self):
        super().__init__()

        self.equalizer = Equalizer_Bars(8, \
        ['#00405e', '#3350a1', '#386787','#0088ba','#3396e6', '#00b9d0','#c1f9f9', '#cce2f7'])

        self.setCentralWidget(self.equalizer)

        self.set_timer = QtCore.QTimer()
        self.set_timer.setInterval(100)
        self.set_timer.timeout.connect(self.update_values)
        self.set_timer.start()

    def update_values(self):
        self.equalizer.size_values([
            min(100, i+random.randint(0, 500) if random.randint(0, 10) > 2 else i)
            for i in self.equalizer.values()
            ])

# start the program
app = QtWidgets.QApplication([])
w = Window()
w.show()
app.exec_()Thursday, February 27, 2020
Python 3.6.9 : Google give a new tool for python users.
Today I discovered a real surprise gift made by the team from Google for the evolution of programmers.
I say this because not everyone can afford hardware resources.
This gift is a new tool called Colab and uses these versions of python and sys:
Colab allows you to use and share Jupyter notebooks because is an open-source project on which Colab is based.
The types of GPUs that are available in Colab varies over time.
This is necessary for Colab to be able to provide access to these resources for free.
The GPUs available in Colab often include Nvidia K80s, T4s, P4s, and P100s.
This way you can test demanding modules like the python TensorFlow module.
The utility is free but you can pay extra for more hardware resources.
Colab notebooks are stored in Google Drive, or can be loaded from GitHub.
You can see a simple intro with a notebook on my GitHub account.
I say this because not everyone can afford hardware resources.
This gift is a new tool called Colab and uses these versions of python and sys:
Python version
3.6.9 (default, Nov  7 2019, 10:44:02)
[GCC 8.3.0]
Version info.
sys.version_info(major=3, minor=6, micro=9, releaselevel='final', serial=0)Colab allows you to use and share Jupyter notebooks because is an open-source project on which Colab is based.
The types of GPUs that are available in Colab varies over time.
This is necessary for Colab to be able to provide access to these resources for free.
The GPUs available in Colab often include Nvidia K80s, T4s, P4s, and P100s.
This way you can test demanding modules like the python TensorFlow module.
The utility is free but you can pay extra for more hardware resources.
Colab notebooks are stored in Google Drive, or can be loaded from GitHub.
You can see a simple intro with a notebook on my GitHub account.
Tuesday, February 25, 2020
Python 3.7.6 : The new concepts of execution in python 3 - part 001.
The main goal of these tutorials series is learning to deal with python source code using the new concepts of execution in python 3.
When two or more events are concurrent it means that they are happening at the same time.
Concurrent programming is not equivalent to parallel execution.
In computing, concurrency is the execution of pieces of work or tasks by a computer at the same time.
Concurrency is a property which more than one operation can be run simultaneously.
When multiple computations or operations are carried out at the same time or in parallel with the goal of speeding up the computation process then this process is named parallelism.
Parallelism is a property which operations are actually being run simultaneously using the multiprocessing.
Multiprocessing, on the other hand, involves utilizing two or more processor units on a computer to achieve parallelism.
Multithreading is a property that refers to the ability of a CPU to execute multiple threads concurrently.
Python’s concurrency methods including threading, multiprocessing, and asyncio.
The difference between the threading and multiprocessing is this: the threading module uses threads, the multiprocessing module uses processes.
The threading is the package that provides API to create and manage threads.
With multiprocessing, Python creates new processes using an API similar to the threading module.
The asyncio is a library to write concurrent code using the async/await syntax.
The keyword async indicates that our function is a coroutine meaning they choose when to pause and let others execute and run coroutines multitask cooperatively.
The three fundamental advantages of async and await over threads are:
The timeit python package is used to benchmark the code write in the code_to_test variable:
Let's test the multi-threading execution with python:
When two or more events are concurrent it means that they are happening at the same time.
Concurrent programming is not equivalent to parallel execution.
In computing, concurrency is the execution of pieces of work or tasks by a computer at the same time.
Concurrency is a property which more than one operation can be run simultaneously.
When multiple computations or operations are carried out at the same time or in parallel with the goal of speeding up the computation process then this process is named parallelism.
Parallelism is a property which operations are actually being run simultaneously using the multiprocessing.
Multiprocessing, on the other hand, involves utilizing two or more processor units on a computer to achieve parallelism.
Multithreading is a property that refers to the ability of a CPU to execute multiple threads concurrently.
Python’s concurrency methods including threading, multiprocessing, and asyncio.
The difference between the threading and multiprocessing is this: the threading module uses threads, the multiprocessing module uses processes.
The threading is the package that provides API to create and manage threads.
With multiprocessing, Python creates new processes using an API similar to the threading module.
The asyncio is a library to write concurrent code using the async/await syntax.
The keyword async indicates that our function is a coroutine meaning they choose when to pause and let others execute and run coroutines multitask cooperatively.
The three fundamental advantages of async and await over threads are:
- cooperative multitasking - you can reasonably have millions of concurrent tasks;
- using await makes visible where the schedule points;
- if a task doesn’t yield then it can accidentally block all other tasks from running;
- tasks can support cancellation.
The timeit python package is used to benchmark the code write in the code_to_test variable:
Let's test the multi-threading execution with python:
[mythcat@desk ~]$ python3
Python 3.7.6 (default, Jan 30 2020, 09:44:41)
[GCC 9.2.1 20190827 (Red Hat 9.2.1-1)] on linux
Type "help", "copyright", "credits" or "license" for more information.
>>> import timeit
>>> code_to_test = """
... import threading
...
... text = "Hello World"
...
... def print_text(text):
...     for char in text:
...             print (char)
...
... # multi-threading execution
... def multi_threads():
...     thread_1 = threading.Thread(target=print_text(text))
...     thread_2 = threading.Thread(target=print_text(text))
...     thread_1.start()
...     thread_2.start()
...     thread_1.join()
...     thread_2.join()
... multi_threads()
... """
>>>
>>> elapsed_time = timeit.timeit(code_to_test, number=1)
H
e
l
l
o

W
o
r
l
d
H
e
l
l
o

W
o
r
l
d
>>> print(elapsed_time)
0.010613240000566293[mythcat@desk ~]$ python3
Python 3.7.6 (default, Jan 30 2020, 09:44:41)
[GCC 9.2.1 20190827 (Red Hat 9.2.1-1)] on linux
Type "help", "copyright", "credits" or "license" for more information.
>>> import timeit
>>> code_to_test = """
... import threading
...
... text = "Hello World"
...
... def print_text(text):
... for char in text:
... print (char)
... # serially execution
... def serially():
... print_text(text)
... print_text(text)
... serially()
... """
>>> elapsed_time = timeit.timeit(code_to_test, number=1)
H
e
l
l
o
W
o
r
l
d
H
e
l
l
o
W
o
r
l
d
>>> print(elapsed_time)
0.011771811000471644[mythcat@desk ~]$ python3
Python 3.7.6 (default, Jan 30 2020, 09:44:41)
[GCC 9.2.1 20190827 (Red Hat 9.2.1-1)] on linux
Type "help", "copyright", "credits" or "license" for more information.
>>> import timeit
>>> code_to_test = """
... import multiprocessing
...
... text = "Hello World"
...
... def print_text(text):
... for char in text:
... print (char)
...
... # multiprocessing execution
... def multiprocessing_test():
... process_1 = multiprocessing.Process(target=print_text(text))
... process_2 = multiprocessing.Process(target=print_text(text))
... process_1.start()
... process_2.start()
... process_1.join()
... process_2.join()
... multiprocessing_test()
... """
>>> elapsed_time = timeit.timeit(code_to_test, number=1)
H
e
l
l
o
W
o
r
l
d
H
e
l
l
o
W
o
r
l
d
>>> print(elapsed_time)
0.3649730779998208Sunday, February 23, 2020
Python 3.7.6 : The SELinux python package.
The tutorial for today is about the SELinux python package.
The official webpage is this.
First, I update my pip tool and I used the python 3.7.6 version:
[mythcat@desk ~]$ pip install --upgrade pip --user
...
Successfully installed pip-20.0.2
Let's install the python package named selinux:
[mythcat@desk ~]$ pip3 install selinux --user
...
Requirement already satisfied: selinux in /usr/lib64/python3.7/site-packages (2.9)
Let's test it:
[mythcat@desk ~]$ python3
Python 3.7.6 (default, Jan 30 2020, 09:44:41)
[GCC 9.2.1 20190827 (Red Hat 9.2.1-1)] on linux
Type "help", "copyright", "credits" or "license" for more information.
>>> import selinux
>>> from selinux import *
>>> print(dir(selinux))>>> selinux.is_selinux_enabled()
1
>>> selinux.selinux_getenforcemode()
[0, 0]
>>> mode = selinux.security_getenforce()
>>> mode
0
>>> selinux.selinux_getpolicytype()
[0, 'mls']
>>> selinux.is_selinux_enabled()
1
>>> selinux.is_selinux_mls_enabled()
1
>>> selinux.get_default_context('mythcat','user_u:object_r:user_home_t:s0')
[-1, None]
>>> context = selinux.matchpathcon(os.path.normpath(/), 0)[1]
>>> context
'system_u:object_r:root_t:s0'
>>> selinux.restorecon('/')
>>> context_t = selinux.getfilecon('/')[1].split(":")[2]
>>> context_t
'root_t'
>>> context_t = selinux.getfilecon('/home/mythcat')[1].split(":")[2]
>>> context_t
'user_home_dir_t'
>>> selinux.matchpathcon('/', mode)
[0, 'system_u:object_r:root_t:s0']
>>> selinux.matchpathcon('/home/mythcat', mode)
[0, 'user_u:object_r:user_home_dir_t:s0']
>>> file_context=selinux.lgetfilecon('/home/mythcat/sel_001.py')
>>> file_context
[31, 'user_u:object_r:user_home_t:s0']
>>> selinux.security_policyvers()
32
Saturday, February 22, 2020
Python 3.7.5 : This python package can work with ArcGIS platform.
This python package is named like the ArcGIS platform and can be used for spatial analysis, mapping, and GIS.
The ArcGIS package uses the ArcGIS platform for organizations to create, manage, share, and analyze spatial data.
This platform has a server component, mobile and desktop applications, and developer tools.
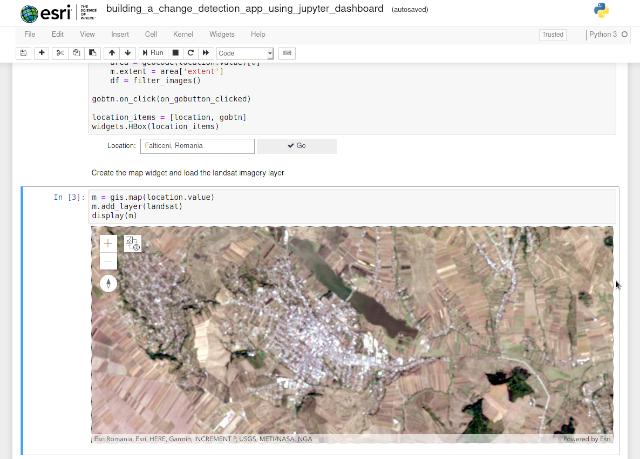
Let's search all maps from world with the maps of disaster using the notebook from esri website.
The ArcGIS package uses the ArcGIS platform for organizations to create, manage, share, and analyze spatial data.
This platform has a server component, mobile and desktop applications, and developer tools.
[mythcat@desk projects]$ pip3 install arcgis --user
...Let's search all maps from world with the maps of disaster using the notebook from esri website.
from arcgis.gis import GIS
from arcgis.geocoding import geocode
from IPython.display import display
from arcgis.mapping import WebMap
from arcgis.geoprocessing import import_toolbox
gis = GIS()
map1 = gis.map()

webmap_search = gis.content.search("disaster", item_type="Web Map")
webmap_search[<Item title:"Hurricane and Cyclone Web Map" type:Web Map owner:cfernerDRP>,
<Item title:"Severe Weather Web Map" type:Web Map owner:cfernerDRP>,
<Item title:"NYC OEM Hurricane Evacuation Zones" type:Web Map owner:nfurness>,
<Item title:"County of San Diego Emergency Map (Live)" type:Web Map owner:oes_services>,
<Item title:"Zombie US" type:Web Map owner:wjones_mt>,
<Item title:"2009 Social Vulnerability in the United States (Mature Support)" type:Web Map owner:esri>,
<Item title:"Waldo Canyon Fire - Consolidated Public Information" type:Web Map owner:jpfeffer>,
<Item title:"US Wildfire Activity Web Map" type:Web Map owner:cfernerDRP>,
<Item title:"Earthquake Web Map" type:Web Map owner:cfernerDRP>,
<Item title:"Current Weather and Wind Station Information" type:Web Map owner:esri_livefeeds>]map_one = webmap_search[1]
map_oneWednesday, February 19, 2020
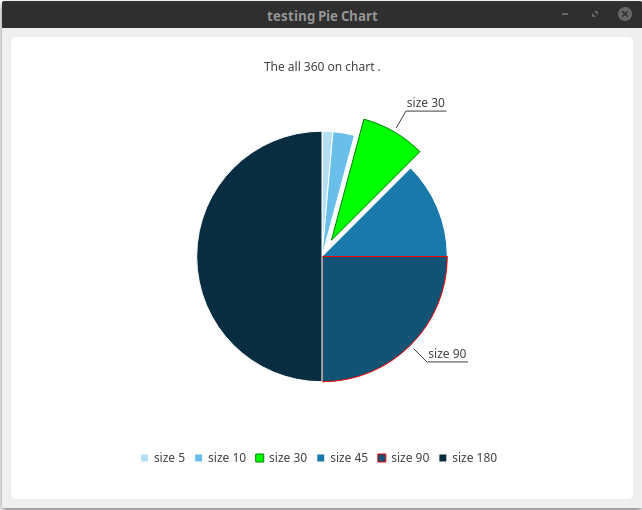
Python 3.7.5 : The PyQtChart from python Qt5.
The PyQtChart is a set of Python bindings for The Qt Company’s Qt Charts library and is implemented as a single module.
Let's install this python package with the pip3 tool:
Let's install this python package with the pip3 tool:
[mythcat@desk ~]$ pip3 install PyQtChart --user
...
Installing collected packages: PyQtChart
Successfully installed PyQtChart-5.14.0from PyQt5.QtWidgets import QApplication, QMainWindow
import sys
from PyQt5.QtChart import QChart, QChartView, QPieSeries, QPieSlice
from PyQt5.QtGui import QPainter, QPen
from PyQt5.QtCore import Qt
class Window(QMainWindow):
def __init__(self):
super().__init__()
self.setWindowTitle("testing Pie Chart")
self.setGeometry(100,100, 640,480)
self.show()
self.create_piechart()
def create_piechart(self):
series = QPieSeries()
#append all values with a sum of 360
series.append("size 5", 5)
series.append("size 10", 10)
series.append("size 30", 30)
series.append("size 45", 45)
series.append("size 90", 90)
series.append("size 180", 180)
#adding slice
slice = QPieSlice()
slice = series.slices()[2]
slice.setExploded(True)
slice.setLabelVisible(True)
slice.setPen(QPen(Qt.darkGreen, 1))
slice.setBrush(Qt.green)
slice = series.slices()[4]
slice.setExploded(False)
slice.setLabelVisible(True)
slice.setPen(QPen(Qt.red, 1))
#slice.setBrush(Qt.blue)
#create chart
chart = QChart()
#chart.legend().hide()
chart.addSeries(series)
chart.createDefaultAxes()
chart.setAnimationOptions(QChart.SeriesAnimations)
chart.setTitle("The all 360 on chart .")
chart.legend().setVisible(True)
chart.legend().setAlignment(Qt.AlignBottom)
chartview = QChartView(chart)
chartview.setRenderHint(QPainter.Antialiasing)
self.setCentralWidget(chartview)
App = QApplication(sys.argv)
window = Window()
sys.exit(App.exec_())
Subscribe to:
Posts (Atom)