News about python from www.python.org.
Python 2.6.9 is a security-fix source-only release for Python 2.6.8, fixing several reported security issues: issue 16037, issue 16038, issue 16039, issue 16040, issue 16041, and issue 16042 (CVE-2013-1752, long lines consuming too much memory), as well as issue 14984 (security enforcement on $HOME/.netrc files), issue 16248 (code execution vulnerability in tkinter), and issue 18709 (CVE-2013-4238, SSL module handling of NULL bytes inside subjectAltName).
Thursday, October 31, 2013
Monday, October 21, 2013
Python versus Matlab - good article by Luis Pedro Coelho
Luis Pedro Coelho is a computational biologist at EMBL.
In this article Luis Pedro Coelho come with many arguments about Python versus Matlab.
Very good article ...
In this article Luis Pedro Coelho come with many arguments about Python versus Matlab.
Very good article ...
Thursday, October 17, 2013
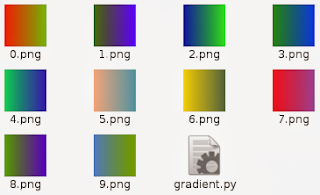
How to make a color gradient and images with python script.
The Image and ImageDraw provide simple 2D graphics to create new images, annotate or retouch existing images, and to generate graphics.
Also this can help you to make on the fly images for you.
Let's see one example ...
First you need to import this modules and random python module
import Image,ImageDraw
from random import randint as rint
The next step : make one image , get some random numbers...
You need two colors : first is one random color and second is make from first color, see next source code:
img = Image.new("RGB", (500,500), "#FFFFFF")
draw = ImageDraw.Draw(img)
r,g,b = rint(0,255), rint(0,255), rint(0,255)
dr = (rint(0,255) - r)/500.
dg = (rint(0,255) - g)/500.
db = (rint(0,255) - b)/500.
Now you need to draw lines with this gradient of two colors.
    for i in range(500):
        r,g,b = r+dr, g+dg, b+db
        draw.line((i,0,i,500), fill=(int(r),int(g),int(b)))
... and the python script source code:
import Image,ImageDraw
from random import randint as rint

def random_gradient(name):
    img = Image.new("RGB", (500,500), "#FFFFFF")
    draw = ImageDraw.Draw(img)

    r,g,b = rint(0,255), rint(0,255), rint(0,255)
    dr = (rint(0,255) - r)/500.
    dg = (rint(0,255) - g)/500.
    db = (rint(0,255) - b)/500.
    for i in range(500):
        r,g,b = r+dr, g+dg, b+db
        draw.line((i,0,i,500), fill=(int(r),int(g),int(b)))

    img.save(name+".png", "PNG")

if __name__ == "__main__":
    for name in range(10):
        random_gradient(str(name))
The result of this script will make images :
Sunday, September 22, 2013
Jython - funny and simple scripts - first steps .
I play today with jython and can be fun but seams to be to slow in a linux os.
Jython is invoked using the "jython" script and it's an implementation of Python for the JVM.
Install the package jython in your linux distro and you can start to deal with java and python.
When you use jython then script will start with :
#!/usr/bin/env jython I make also some very simple scripts...
First script make one button and give a action to exit.
#!/usr/bin/env jython
from javax import *
import java
from java import *
import sys

frame = awt.Frame(size=(500,100))
frame.background = 255,255,0
def exit(event):
  java.lang.System.exit(0)

my_button = awt.Button("Exit!", actionPerformed=exit)
frame.add(my_button,"Center")
frame.pack()
frame.setVisible(1)
The output is:

The script is easy to make ... it's like gtk with add, pack and action ...
Let's see the next script : one list.
from javax import *
from java import awt
import sys
python_list=[]
python_list.append('text 1')
python_list.append('text 2')
python_list.append('text 3')
python_list.append('text 4')
python_list.append('text 5')

frame=awt.Frame("test list")
panel=swing.JList(python_list)
frame.add(panel,"Center")
frame.pack()
frame.setVisible(1)
... and this is the gui with the list:
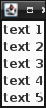
I make a simple list and add to the gui using pack() function.
The jython is not easy is much to learn and if you want then go to this website.
Check system , distro and commands using python scripts .
This is a simple example with two functions.
First will check the linux command : ls linux command.
The next function will give us some infos about system.
import shlex
import subprocess
from subprocess import Popen, PIPE

import platform

def check_command(command):
    cmd='which ' + command
    output = Popen(shlex.split(cmd), stdout=PIPE).communicate()[0]
    command_path =output.split('\n')[0]
    print command_path
    return command_path

def check_platform():
    arch, exe = platform.architecture()
    my_system = platform.system()
    if my_system == 'Linux':
        distro_name, distro_version, distro_id = platform.linux_distribution()
    elif my_system == 'Darwin':
        distro_name, distro_version, distro_id = platform.mac_ver()
    elif my_system == 'Windows':
 distro_name, distro_version, distro_id = platform.win32_ver()
    elif my_system == 'Java':
 distro_name, distro_version, distro_id = platform.java_ver()
    processor = platform.processor() or 'i386'
    print processor, my_system, arch, distro_name, distro_version, distro_id
    return processor, my_system, arch, distro_name, distro_version, distro_id

check_command('ls')

check_platform()
This python script can be use with any scripts when we need to test commands and system , distro version.
Thursday, September 12, 2013
Working with SunPy python module - part 001 .
The SunPy python module it's an open-source software library for solar physics using the Python programming language.
The SunPy module is included into nasa projects.
Now, if you want to use this python module then you need to install lapack and blas libraries for development.
I use # pip under super user account to install sunpy and the python modules required by SunPy.
# pip install --upgrade distribute
# pip install --upgrade pyfits
# pip install --upgrade suds
# pip install --upgrade pandas
# pip install --upgrade beautifulsoup4
... also you need to have this python modules: Scipy and Matplotlib.
After that you can install sunpy using:
# pip install sunpy
# pip install --upgrade sunpy
The basic example is one output created by Map() function.
This function can deal with many data sources, like:
SDO/AIA, SDO/HMI
STEREO/EUVI, STEREO/COR
Hinode/XRT
SOHO/EIT, SOHO/LASCO, SOHO/MDI
PROBA2/SWAP
Yohkoh/SXT
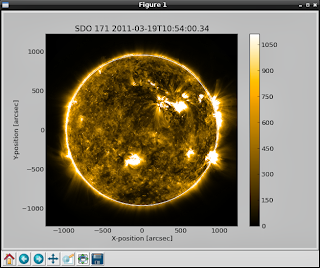
Let's try a simple example and will show the result...
>>> import sunpy
>>> ati_map=sunpy.Map(sunpy.AIA_171_IMAGE).peek()
... and output is:
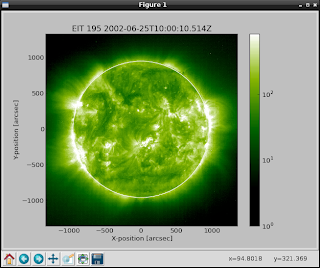
Let's make more sun maps...
>>> eit_map=sunpy.Map(sunpy.EIT_195_IMAGE).peek() The the output is:
>>> rhessi_map=sunpy.Map(sunpy.RHESSI_IMAGE).peek() You can see radio spectrometer image using:
>>> callisto_radio_maps=sunpy.Map(sunpy.CALLISTO_IMAGE).peek() 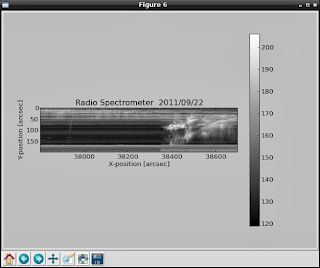
Also you can combine the maps , like in the next example:
>>> eti_rhessi_maps=sunpy.Map(sunpy.EIT_195_IMAGE, sunpy.RHESSI_IMAGE, composite=True).peek() 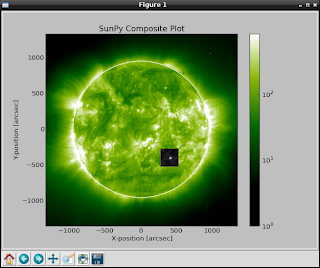
You can get more infos about Map using :
>>> help(sunpy.Map) If you want more data to show then you can request data from here.
Also you can give parameters to the Map, like:
date : datetime
 |          Image observation time
...
This allow you to take more data and info...
Using matplotlib and scipy modules can help to parse and show all infos.
Subscribe to:
Posts (Atom)