analitics

Pages

Showing posts with label packages. Show all posts

Thursday, January 19, 2023

Python 3.11.0 : The parfive python package.

Today I tested this simple parfive 2.0.2 version python package with the default example from the official website.
A parallel file downloader using asyncio. parfive can handle downloading multiple files in parallel as well as downloading each file in a number of chunks.
The default example works great but when I try to get direct movie files from free web this not work.
Parfive is a lightweight library, I try to download large files but give me error 206.

Thursday, January 12, 2023

Python 3.11.0 : The numpy-quaternion python package - part 001.

I write an article on my website about artificial intelligence and I used python to show a simple example with quaternions.
This Python module adds a quaternion dtype to NumPy and you can read about this on the official website.
I may have mistakenly installed a python packet with a similar name and I had to install it with the command:
python -m pip uninstall quaternion
the next step was to install this command
python -m pip install --upgrade --no-deps --force-reinstall numpy-quaternion
The source code I used defines two quaternions, one with real part a and imaginary parts, and one quaternion using Euler angles.
Then is perform the rotation uses quaternion multiplication.
Let's see the source code
import numpy as np
import quaternion

# define a quaternion with real part a and imaginary parts bi, cj, dk
a = 1
b = 2
c = 3
d = 4
q = np.quaternion(a, b, c, d)

# define a quaternion using euler angles
x = 1.0
y = 2.0
z = 3.0
q2 = quaternion.from_euler_angles(x, y, z)

# define a vector to rotate
v = [1, 0, 0]

# perform the rotation using quaternion multiplication

# quaternion multiplication is not commutative, the order matters
# because this line of source code will not work:  rotated_v = q2 * v * q2.conj()

rotated_v = (q2 * quaternion.quaternion(0, *v)) * q2.conj()

print(rotated_v)
This is the result:
quaternion(0, 0.103846565151668, 0.422918571742548, 0.900197629735517)

Wednesday, January 11, 2023

Python 3.7.9 : simple zodiac diagrams with ephem and matplotlib.

I used openai chat to test another issue with these python packages: ephem and matplotlib.
It seems that openai is limited to new changes in python packages, but it resolves quite well combinations of source code that it has corrected with defined errors. It can't really extract source code from general questions. Anyway, it is a very good help for a programmer in the initial phase of any project.
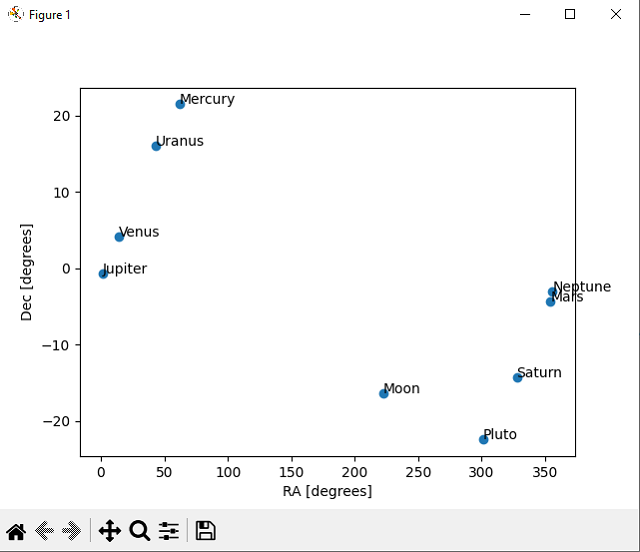
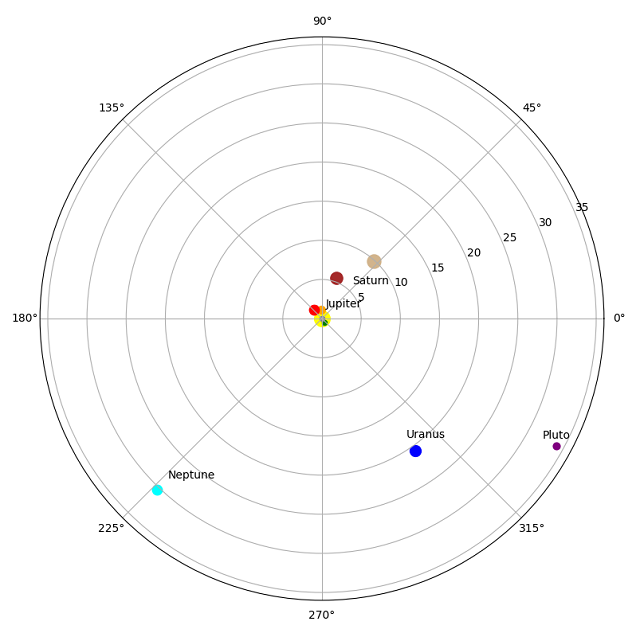
This source code show two diagrams about the solar system on a specific date:
import ephem
import matplotlib.pyplot as plt

# create an observer
obs = ephem.Observer()

# set the observer's location
obs.lat = '47.27' # latitude
obs.lon = '26.18' # longitude
obs.elevation = 307 # elevation (meters)

# set the date and time of the observation
obs.date = '2022/05/15 12:00:00' # date and time
# if you want you can use now() for real time data

# create the bodies
mercury = ephem.Mercury(obs)
venus = ephem.Venus(obs)
mars = ephem.Mars(obs)
jupiter = ephem.Jupiter(obs)
saturn = ephem.Saturn(obs)
uranus = ephem.Uranus(obs)
neptune = ephem.Neptune(obs)
pluto = ephem.Pluto(obs)
moon = ephem.Moon(obs) 

# compute the position of each planet and the moon
mercury.compute(obs)
venus.compute(obs)
mars.compute(obs)
jupiter.compute(obs)
saturn.compute(obs)
uranus.compute(obs)
neptune.compute(obs)
pluto.compute(obs)
moon.compute(obs)  

# extract ra and dec coordinates of each body
ra = [mercury.ra, venus.ra, mars.ra, jupiter.ra, saturn.ra, uranus.ra, neptune.ra, pluto.ra,moon.ra]
dec = [mercury.dec, venus.dec, mars.dec, jupiter.dec, saturn.dec, uranus.dec, neptune.dec, pluto.dec,moon.dec]

# convert ra,dec from radians to degrees
ra = [r*180/ephem.pi for r in ra]
dec = [d*180/ephem.pi for d in dec]
print(ra,dec)
# create a scatter plot of the positions
plt.scatter(ra, dec)

# add labels for each planet
plt.annotate('Mercury', (ra[0], dec[0]))
plt.annotate('Venus', (ra[1], dec[1]))
plt.annotate('Mars', (ra[2], dec[2]))
plt.annotate('Jupiter', (ra[3], dec[3]))
plt.annotate('Saturn', (ra[4], dec[4]))
plt.annotate('Uranus', (ra[5], dec[5]))
plt.annotate('Neptune', (ra[6], dec[6]))
plt.annotate('Pluto', (ra[7], dec[7]))
plt.annotate('Moon', (ra[8], dec[8]))

plt.xlabel("RA [degrees]")
plt.ylabel("Dec [degrees]")

# show the plot
plt.show()

# Set the figure size
plt.figure(figsize=(10, 10))

# Define the polar axis
ax = plt.subplot(111, projection='polar')

# Set the axis limits
ax.set_ylim(0, 36)

# Plot the Sun at the center
plt.scatter(0, 0, s=200, color='yellow')

mercury_distance = mercury.earth_distance
venus_distance= venus.earth_distance
mars_distance= mars.earth_distance
jupiter_distance= jupiter.earth_distance
saturn_distance= saturn.earth_distance
uranus_distance= uranus.earth_distance
neptune_distance= neptune.earth_distance
pluto_distance= pluto.earth_distance
moon_distance= moon.earth_distance
print(mercury_distance)
distance = [mercury_distance,venus_distance,mars_distance,jupiter_distance,saturn_distance,uranus_distance,neptune_distance,pluto_distance,moon_distance]

# Plot the planets
plt.scatter(ra[0], distance[0], s=20, color='green')
plt.scatter(ra[1], distance[1], s=50, color='orange')
plt.scatter(ra[2], distance[2], s=80, color='red')
plt.scatter(ra[3], distance[3], s=120, color='brown')
plt.scatter(ra[4], distance[4], s=150, color='tan')
plt.scatter(ra[5], distance[5], s=100, color='blue')
plt.scatter(ra[6], distance[6], s=80, color='cyan')
plt.scatter(ra[7], distance[7], s=40, color='purple')
plt.scatter(ra[8], distance[8], s=20, color='gray')

# add the labels for each planet
plt.annotate('Mercury',(ra[0], distance[0]),xytext=(ra[0], distance[0] - 2))
plt.annotate('Venus',(ra[1], distance[1]),xytext=(ra[1], distance[1] - 2))
plt.annotate('Mars',(ra[2], distance[2]),xytext=(ra[2], distance[2] - 2))
plt.annotate('Jupiter',(ra[3], distance[3]),xytext=(ra[3], distance[3] - 4))
plt.annotate('Saturn',(ra[4], distance[4]),xytext=(ra[4], distance[4] - 4))
plt.annotate('Uranus',(ra[5], distance[5]),xytext=(ra[5], distance[5] - 2))
plt.annotate('Neptune',(ra[6], distance[6]),xytext=(ra[6], distance[6] - 2))
plt.annotate('Pluto',(ra[7], distance[7]),xytext=(ra[7], distance[7] - 2))
plt.annotate('Moon',(ra[8], distance[8]),xytext=(ra[8], distance[8] - 2))

# Show the plot
plt.show()
This is the result of this source code:

Python 3.7.9 : simple zodiac constellation with ephem.

This time I used openai chat to create my source code and with small changes it worked…
PyEphem provides an ephem Python package for performing high-precision astronomy computations. The underlying numeric routines are coded in C and are the same ones that drive the popular XEphem astronomy application, whose author, Elwood Charles Downey, generously gave permission for their use in PyEphem. The name ephem is short for the word ephemeris, which is the traditional term for a table giving the position of a planet, asteroid, or comet for a series of dates.
import ephem

# create an observer
obs = ephem.Observer()

# set the observer's location
obs.lat = '47.27' # latitude
obs.lon = '26.18' # longitude
obs.elevation = 307 # elevation (meters)

# set the date and time of the observation
obs.date = '2022/05/15 12:00:00' # date and time

# create the bodies
mercury = ephem.Mercury(obs)
venus = ephem.Venus(obs)
mars = ephem.Mars(obs)
jupiter = ephem.Jupiter(obs)
saturn = ephem.Saturn(obs)
uranus = ephem.Uranus(obs)
neptune = ephem.Neptune(obs)
pluto = ephem.Pluto(obs)
moon = ephem.Moon(obs)

# print the constellation
print("Mercury:", ephem.constellation(mercury))
print("Venus:", ephem.constellation(venus))
print("Mars:", ephem.constellation(mars))
print("Jupiter:", ephem.constellation(jupiter))
print("Saturn:", ephem.constellation(saturn))
print("Uranus:", ephem.constellation(uranus))
print("Neptune:", ephem.constellation(neptune))
print("Pluto:", ephem.constellation(pluto))
print("Moon:", ephem.constellation(moon))
This is result of the running source code:
python constelation001.py
Mercury: ('Tau', 'Taurus')
Venus: ('Psc', 'Pisces')
Mars: ('Aqr', 'Aquarius')
Jupiter: ('Psc', 'Pisces')
Saturn: ('Cap', 'Capricornus')
Uranus: ('Ari', 'Aries')
Neptune: ('Psc', 'Pisces')
Pluto: ('Sgr', 'Sagittarius')
Moon: ('Lib', 'Libra')

Tuesday, January 10, 2023

Python 3.7.9 : simple zodiac with pyephem and ephem.

I don't know how to calculate a zodiac exactly, from what I understand the planets and the moon must overlap. so I tested a script that calculates the dates between the planets and the moon when they appear within one degree of each other and displays them in an array with rows and columns created from these planets and the moon. The intersections on the diagonal should be none because there's obviously no way to overlap the same object, and they only occur when there's this less than one degree rule.
If you think it is wrong then you can try to fix it.
You can install pyephem and ephem with pip tool, I used both python packages:
pip install pyephem --user
Requirement already satisfied: pyephem in 
... site-packages (9.99)
Requirement already satisfied: ephem in 
...
site-packages (from pyephem) (4.1.4)
This is the source script.
import ephem

# create a list with planets objects from ephem
planets = [ephem.Mercury(), ephem.Venus(), ephem.Mars(), ephem.Jupiter(), ephem.Saturn(), ephem.Uranus(), ephem.Neptune(), ephem.Moon()]

start_date = ephem.Date("2023/01/01")
end_date = ephem.Date("2023/12/31")
date = start_date

# create matrix to store planet names and conjunction dates
matrix = [[None for _ in range(len(planets) + 1)] for _ in range(len(planets))]

# create list to store planet names
planet_names = [planet.name for planet in planets]
# list all planets names as first row in matrix
matrix.insert(0, [""] + planet_names)

while date < end_date:
    for i, planet1 in enumerate(planets):
        for j, planet2 in enumerate(planets):
            if i < j:
                planet1.compute(date)
                planet2.compute(date)
                sep = ephem.separation(planet1, planet2) #  calculate the angular distance
                # compare the separation, if less than 0.01 degree then it's a conjunction
                if sep < 1.0:
                    date_formatted = date.datetime().strftime("%d %B %Y")
                    matrix[i+1][j+1] = date_formatted
                    break
    date = ephem.Date(date + 1)
# print a matrix with date is separation from 1 degree between planets on rows and column
for row in matrix:
    print(row)
This is the result:
['', 'Mercury', 'Venus', 'Mars', 'Jupiter', 'Saturn', 'Uranus', 'Neptune', 'Moon']
[None, None, '30 December 2023', '14 December 2023', '20 June 2023', None, None, None, None]
[None, None, None, '30 December 2023', '15 March 2023', '06 January 2023', None, None, '12 October 2023']
[None, None, None, None, None, None, '24 April 2023', None, '16 December 2023']
[None, None, None, None, None, '05 June 2023', '30 December 2023', None, None]
[None, None, None, None, None, None, None, '30 December 2023', None]
[None, None, None, None, None, None, None, '30 December 2023', None]
[None, None, None, None, None, None, None, None, '23 December 2023']
[None, None, None, None, None, None, None, None, None]

Sunday, January 8, 2023

Python 3.7.9 : The sunpy python package - part 001.

In the past, I have written several small tutorials related to this Python package. Now I have some news related to the sunpy python package:
  • HelioviewerClient is deprecated;
  • The Helioviewer Project now maintains a Python Wrapper called hvpy.
  • sunpy users are encouraged to upgrade parfive python package;
  • the sunpy.database deprecation;
  • the sample data files provided through sunpy.data.sample are now downloaded individually on demand;
  • SunPy is tested against Python 2.7, 3.5, and 3.6.;
  • SunPy no longer supports Python 3.4.;
  • easy to extract data values from a GenericMap along a curve specified by a set of coordinates using the new sunpy.map.extract_along_coord function;
  • has a new make_heliographic_header() function that simplifies creating map headers that span the whole solar surface in Carrington or Stonyhurst coordinates;
  • aiaprep is now deprecated;
  • ... and more on the official website.
I install this python package on the Windows OS with the pip tool:
pip install "sunpy[all] -U"
You can install extra available options: [asdf], [dask], [database], [image], [jpeg2000], [map], [net], [timeseries], [visualization].
You can see the version of this python package with this source code:
 import sunpy
print(sunpy.__version__)
3.1.8
I tested this package with this simple source code:
from matplotlib import pyplot as plt
import sunpy.map
import sunpy.data.sample  
sunpyAIA = sunpy.map.Map(sunpy.data.sample.AIA_171_IMAGE) 
sunpyAIA.plot()
plt.colorbar()
plt.show()
The instrument is AIA and the measurement is 171, see more on this online tool named helioviewer.
After I run I got this image:

Python 3.11.0 : The scapy python module - part 003.

Scapy is a powerful interactive packet manipulation program. It is able to forge or decode packets of a wide number of protocols, send them on the wire, capture them, match requests and replies, and much more. It can easily handle most classical tasks like scanning, tracerouting, probing, unit tests, attacks or network discovery (it can replace hping, 85% of nmap, arpspoof, arp-sk, arping, tcpdump, tshark, p0f, etc.). It also performs very well at a lot of other specific tasks that most other tools can’t handle, like sending invalid frames, injecting your own 802.11 frames, combining technics (VLAN hopping+ARP cache poisoning, VOIP decoding on WEP encrypted channel, …), etc.
First, you need to install it with pip tool: pip install scapy --user.
I used with WinPcap from this webpage, but you will see the recomandation is to use Npcap.
#!/usr/bin/env python3
import os
print(os.sys.path)
from scapy.all import *

def mysniff(interface):
    sniff(iface=interface, store=False, prn=process_sniffed_packet)

def process_sniffed_packet(packet):
    pyperclip.copy(str(packet))
    print(packet)

mysniff("Realtek PCIe GbE Family Controller")
The running result is something like this:
...
WARNING: WinPcap is now deprecated (not maintained). Please use Npcap instead
Ether / IP / TCP 104.244.42.2:https > 192.168.0.143:55478 PA / Raw
Ether / IP / TCP 192.168.0.143:55478 > 104.244.42.2:https PA / Raw
Ether / IP / TCP 104.244.42.2:https > 192.168.0.143:55478 A / Padding
Ether / ARP who has 192.168.0.1 says 192.168.0.206 / Padding
...

Thursday, January 5, 2023

Python Qt6 : Create a tray icon application.

The notification area known as system tray is located in the Windows Taskbar area, usually at the bottom right corner.
I tested with:
Python 3.10.2 (tags/v3.10.2:a58ebcc, Jan 17 2022, 14:12:15) [MSC v.1929 64 bit (AMD64)] on win32
...
pip show pyqt6
Name: PyQt6
Version: 6.4.0
Summary: Python bindings for the Qt cross platform application toolkit
I created a trayicon application with PyQt6 that show a menu with two entry: Show Window and Exit.
The Show Window will sow a default window and the Exit will close the application.
This is the source code I tested, you need an icon.png in the same folder with this script.
import sys
from PyQt6.QtCore import Qt, QEvent, QPoint
from PyQt6.QtGui import QGuiApplication, QIcon, QAction
from PyQt6.QtWidgets import QApplication, QSystemTrayIcon, QMainWindow, QMenu

# create the default application
app = QApplication(sys.argv)

# create the main window
window = QMainWindow()
# set the title for the window
window.setWindowTitle("My Window")

# this set the tray icon and menu
tray_icon = QSystemTrayIcon()
tray_icon.setIcon(QIcon("icon.png"))
menu = QMenu()

# add an action to the menu to show the window
show_window_action = QAction("Show Window", None)
show_window_action.triggered.connect(window.show)
menu.addAction(show_window_action)

# add an action to the menu to exit the application
exit_action = QAction("Exit", None)
exit_action.triggered.connect(app.quit)
menu.addAction(exit_action)

# set the context menu
tray_icon.setContextMenu(menu)

# show the tray icon
tray_icon.show()

# run the application
app.exec()

Tuesday, January 3, 2023

Python 3.10.2 : about ChemSpiPy.

ChemSpiPy provides a way to interact with ChemSpider in Python. It allows chemical searches, chemical file downloads, depiction and retrieval of chemical properties...
You can read more about this python package on the official website and the documentation for this python package.
You have to create an account and fill in the data to get an A.P.I key...
This is the source code for this python package , I use PyQt6 to show image formula with:QPixmap.fromImage.
import chemspipy

# set the API key from https://developer.rsc.org/my-apps/
api_key = "... your A.P.I. key ..."

# import the ChemSpider class
from chemspipy import ChemSpider

# instance of the ChemSpider class
cs_inst = ChemSpider(api_key)

compound_name = "Glucose"
# search for compound: "Glucose"
compounds  = cs_inst.search(compound_name) 

# get the first compound in the list
compound = compounds[0]

# print the list of the attributes and methods of 'compound' object
print(dir(compound))

# Print the compound's properties
print("... some compound's properties !")
print(f"Name: {compound.common_name}")
print(f"Average_mass: {compound.average_mass}")
print(f"ChemSpider ID - csid: {compound.csid}")
#print(f" external_references: {compound.external_references}")
#print(f" image: {compound.image}")
#print(f" mol_2d: {compound.mol_2d}")
#print(f" mol_3d: {compound.mol_3d}")
print(f" molecular_formula: {compound.molecular_formula}")
print(f" molecular_weight: {compound.molecular_weight}")
print(f" monoisotopic_mass: {compound.monoisotopic_mass}")
print(f" nominal_mass: {compound.nominal_mass}")


import sys
from PyQt6.QtCore import Qt
from PyQt6.QtGui import QPixmap, QImage, QColor
from PyQt6.QtWidgets import QApplication, QMainWindow, QLabel

# Create the application
app = QApplication(sys.argv)

# Create the main window
window = QMainWindow()
window.setWindowTitle(compound_name)

# Load the image with fromData
image = QImage.fromData(compound.image)

# Create a label to display the image
label = QLabel()
label.setPixmap(QPixmap.fromImage(image))

# Set the label as the central widget of the window
window.setCentralWidget(label)

# Show the window
window.show()

# Run the application
app.exec()
This is the result of running the source code:

Python 3.10.2 : testing the NASA A.P.I. features.

In this tutorial I will show you how to deal with the NASA A.P.I. and python programming language.
This source code was build and tested yesterday.
This is the source code:
import requests
from datetime import date

today_data = date.today()
today = today_data.strftime("%d%m%Y")
import urllib.parse

# set your API key from nasa https://api.nasa.gov/#NHATS
api_key = "... your A.P.I. key ..."

# this is a simple example to get one day image 
base_url = "https://api.nasa.gov/planetary/apod"

# set the parameters for the API request
params = {
    "api_key": api_key
}

# the request to the API
response = requests.get(base_url, params=params)

# get data
if response.status_code == 200:
    # parse the response
    data = response.json()

    # print the image URL
    print(data["url"])
    # parse the URL
    parsed_url = urllib.parse.urlparse(data["url"])

    # extract the file name from the URL
    file_name = parsed_url.path.split("/")[-1]
    # save the image
    response_image = requests.get(data["url"])
    with open(today+'_'+file_name, "wb") as f:
        f.write(response_image.content)
else:
    # print the status code
    print(response.status_code)
I run the source code and I get these two images ...
...
01/03/2023  01:06 AM            86,943 03012023_AllPlanets_Tezel_1080_annotated.jpg
01/03/2023  04:22 PM           553,426 03012023_KembleCascade_Lease_960.jpg
...

Manim python example.

I have written before about manim as a Python package in this tutorial.
It's quite powerful for animation and I recommend it to content producers who need a tool for school board-like graphics.
Today I'm back with a link that a document written in Jupiter notebook with Manim package from manim community, see this link.

Wednesday, December 28, 2022

Python 3.10.2 : Copernicus A.P.I. and python sentinelsat python package - part 001.

Last night I worked a bit with python and tested on the online tool from Copernicus.
Copernicus is the European Union's Earth observation programme, which analyzes our planet and its environment for the benefit of all European citizens.
If you want to test it with python or another A.P>I. you need to create an user and a apassword.This is the source code I used with S:
from sentinelsat import SentinelAPI, read_geojson, geojson_to_wkt
from datetime import date
# Connect to the Sentinel API
api = SentinelAPI('___', '___', 'https://scihub.copernicus.eu/dhus')
#
api.download('___from_copernicus_website___')
# Search for Sentinel-2 images covering a specific area
footprint = geojson_to_wkt(read_geojson('area_of_interest.geojson'))

products = api.query(footprint,
                     date=('20211201', '20211205'),
                     platformname='Sentinel-1')
# convert to Pandas DataFrame
products_df = api.to_dataframe(products)
print(products_df)
# sort and limit to first 5 sorted products
products_df_sorted = products_df.sort_values(['link'], ascending=[True])
products_df_sorted = products_df_sorted.head(5)

# download sorted and reduced products
api.download_all(products_df_sorted.index)
You need a JSOn file to select the area of interest:
After I run this python script, the result is this:
python test001.py
                                                                                  title  ... productconsolidation
8f12995e-8f4b-4634-91bb-4971a1bdd0c3  S1B_IW_SLC__1SDV_20211201T160049_20211201T1601...  ...                  NaN
c62ceac6-c9ac-409d-bea9-d1bc23b1b183  S1B_IW_GRDH_1SDV_20211201T160050_20211201T1601...  ...                  NaN
2d1319c5-60af-468b-904a-5dfbdd5f205c  S1B_IW_RAW__0SDV_20211201T160046_20211201T1601...  ...                SLICE

[3 rows x 36 columns]
Downloading S1B_IW_GRDH_1SDV_20211201T160050_20211201T160115_029834_038FB2_A390.zip: 100%|█| 929M/929M [02:44<00:00, 5.
Downloading products:  33%|██████████████████▋                                     | 1/3 [02:58<05:57, 178.58s/product]
Downloading S1B_IW_RAW__0SDV_20211201T160046_20211201T160119_029834_038FB2_D35D.zip:  83%|▊| 1.31G/1.58G [03:21<00:26,
Downloading S1B_IW_SLC__1SDV_20211201T160049_20211201T160116_029834_038FB2_AC13.zip:  31%|▎| 1.33G/4.35G [03:18<04:16,
...
The copernicus online map can be seen in the next inage:

Monday, December 19, 2022

Python 3.10.2 : MoviePy - part 001.

MoviePy is a Python module for video editing, which can be used for basic operations (like cuts, concatenations, title insertions), video compositing (a.k.a. non-linear editing), video processing, or to create advanced effects. It can read and write the most common video formats, including GIF.
You can read more about this python package on this webpage.
I install this python package with the pip3 tool:
pip3 install MoviePy --user
I have an AVI file type created with the Blender 3D software, named anime_effect_001.avi, you can find it on my youtube channel.
I used this source code to convert it into an mp4 file type:
import moviepy.editor as moviepy
clip = moviepy.VideoFileClip("anime_effect_001.avi")
clip.write_videofile("MP4_anime_effect_001.mp4")
I run with this command:
python moviepy_001.py
Moviepy - Building video MP4_anime_effect_001.mp4.
Moviepy - Writing video MP4_anime_effect_001.mp4
...
Moviepy - Done !
Moviepy - video ready MP4_anime_effect_001.mp4
I play the MP4 file with the VLC video player and works great.

Saturday, December 17, 2022

Python 3.10.2 : Suite for Computer-Assisted Music in Python known as SCAMP.

SCAMP is an computer-assisted composition framework in Python designed to act as a hub, flexibly connecting the composer-programmer to a wide variety of resources for playback and notation. SCAMP allows the user to manage the flow of musical time, play notes either using FluidSynth or via MIDI or OSC messages to an external synthesizer, and ultimately quantize and export the result to music notation in the form of MusicXML or Lilypond. Overall, the framework aims to address pervasive technical challenges while imposing as little as possible on the aesthetic choices of the composer-programmer.
Let's install with pip3 python tool in Windows O.S..
pip3 install --user scamp
I created a python script named music001_test001.py with this source code:
from scamp import *
import random

s = Session()

guitar = s.new_part("Guitar")

text = "this is a test text"

for char in text:
    if char == " ":
        wait(0.2)
    elif char.isalnum():
        for x in range (0,10):
            guitar.play_note(ord(char) - random.randrange(50, 75), random.randint(0,5), random.random()/5)
    else:
        wait(0.2)
        guitar.play_note(ord(char), 0.8, 0.06)
        wait(0.2)
The source code is easy to understand. I use random to play into for loop.
I play these with preset Jazz Guitar for Guitar.
I could say that the result is quite good for the random function.
In my internet searches, I also found a rather interesting PDF file about this Python module and other enhancements. You can find it here.

Monday, December 12, 2022

Python 3.10.2 : Quickstart with streamlit python package.

In today's tutorial, I will give you a brief introduction to the streamlit packet.
Streamlit turns data scripts into shareable web apps in minutes. All in pure Python. No front‑end experience required.
Let's install with the pip tool:
pip install streamlit
After installation, I tested their example with the following command:
python -m streamlit hello
The result in the browser will be this:
You can create a working folder to add a python file called myapp001.py with the following continue:
import streamlit as st 

st.write("""
#testing streamlit
""")
To run this python file with streamlit use the following command:
python -m streamlit run myapp001.py

  Welcome to Streamlit!

  If you’d like to receive helpful onboarding emails, news, offers, promotions,
  and the occasional swag, please enter your email address below. Otherwise,
  leave this field blank.

  Email:  catafest@yahoo.com

  You can find our privacy policy at https://streamlit.io/privacy-policy

  Summary:
  - This open source library collects usage statistics.
  - We cannot see and do not store information contained inside Streamlit apps,
    such as text, charts, images, etc.
  - Telemetry data is stored in servers in the United States.
  - If you'd like to opt out, add the following to %userprofile%/.streamlit/config.toml,
    creating that file if necessary:

    [browser]
    gatherUsageStats = false


  You can now view your Streamlit app in your browser.
...

Friday, October 7, 2022

Python 3.10.7 : Rembg for remove background.

Rembg is a tool to remove images background and the project can be found on the GitHub webpage.
Create a python file named remove_background.py.
Install using the pip tool.
pip install rembg
Collecting rembg
  Downloading rembg-2.0.25-py3-none-any.whl (12 kB)
Add this source code and the input001.png image for procesing in the same folder with the python script.
from rembg import remove 
from PIL import Image 
input_path = 'input001.png'
output_path = 'output001.png'
input = Image.open(input_path)
output = remove(input)
output.save(output_path)
Run the python script and if you see this error:
python remove_background.py
Access denied with the following error:

        Too many users have viewed or downloaded this file recently. Please
        try accessing the file again later. If the file you are trying to
        access is particularly large or is shared with many people, it may
        take up to 24 hours to be able to view or download the file. If you
        still can't access a file after 24 hours, contact your domain
        administrator.

You may still be able to access the file from the browser:

         https://drive.google.com/uc?id=1tCU5MM1LhRgGou5OpmpjBQbSrYIUoYab
         ...
... then copy the u2net.onnx file into this path:
C:\Users\your_user\.u2net\
After I copy the file I run again the python script and this is the result.

Sunday, September 11, 2022

Python : Blockchain Programming - part 001.

This is the first tutorial in the blockchain programming series using the python programming language.
To program a blockchain, we must consider two elements: in addition to the blockchain address, it can have a programmable area and the second essential element, the interaction of the blockchain with external web areas can be programmed.
In this tutorial I will use the python web3 package, an etherium address and an online web utility called infura.io.
In the infura.io account, create a web3 project and in the dashboard - manage key you will have to add the ethereum address and use the url created to mainnet.infura.io.
I created a project in python in Fedora 37 using the conda utility and installed the web3 package.
Here is the python source code I used
from web3 import Web3
node_provider = "https://mainnet.infura.io/v3/1f2fb5d1e1be4c11acdbbb07a2e06a1c"

web3_connection = Web3(Web3.HTTPProvider(node_provider))


def is_connected():
    print(web3_connection.isConnected())

def latest_block():
    print(web3_connection.eth.block_number)

def balanceETH(ETH_address):
    balance = web3_connection.eth.get_balance(ETH_address)
    balance_for_ETH = web3_connection.fromWei(balance,'ether')
    print(balance_for_ETH)
Here is the answer to running this source code using the etherium address:
(web3_001) [mythcat@fedora PythonProjects]$ vi web3_func_001.py
(web3_001) [mythcat@fedora PythonProjects]$ python
Python 3.9.13 (main, Aug 25 2022, 23:26:10)
[GCC 11.2.0] :: Anaconda, Inc. on linux
Type "help", "copyright", "credits" or "license" for more information.
>>> from web3_func_001 import *
>>> is_connected()
True
>>> latest_block()
15516253
>>> balanceETH("0x74E55f28a8A0158b466FcB481EC7e6bE45D1DB91")
0
Since it is a rather complex field, I will come back with other tutorials when I have the necessary resources.

Monday, August 15, 2022

Blender 3D and python scripting - part 025.

In this tutorial I will show a simple python script for add a String interface to the Group Output.
You can see in the next image the result of this script.
You need to have an modifier Geometry Nodes or add new one.
This is the source script with comments for each step I used:
import bpy

#get active object - default 
obj = bpy.context.active_object

# set the default start for working with Geometry Nodes modifier
# you need to have a Geometry Nodes modifier
node_group = obj.modifiers['GeometryNodes'].node_group
nodes = node_group.nodes

#get the node named 'Group Output'
geom_out = nodes.get('Group Output')

#create a string node 
string_node = nodes.new('FunctionNodeInputString')
# set the name to 'String'
string_out = string_node.outputs['String']
# set the value to "This is a string"
string_node.string = "This is a string"

# link to the Group Output
node_group.links.new(string_out, geom_out.inputs[-1])

Wednesday, August 10, 2022

Python 3.10.7 : Manim python package - part 001.

Manim is an engine for precise programmatic animations, designed for creating explanatory math videos, see the official GitHub repo.
Let's install this python package.
python.exe -m pip install manim
...
Successfully installed Pillow-9.2.0 Pygments-2.12.0 certifi-2022.6.15 charset-no
rmalizer-2.1.0 click-8.1.3 click-default-group-1.2.2 cloup-0.13.1 colour-0.1.5 c
ommonmark-0.9.1 decorator-5.1.1 glcontext-2.3.6 idna-3.3 isosurfaces-0.1.0 manim
-0.16.0.post0 manimpango-0.4.1 mapbox-earcut-0.12.11 moderngl-5.6.4 moderngl-win
dow-2.4.1 multipledispatch-0.6.0 networkx-2.8.5 pycairo-1.21.0 pydub-0.25.1 pygl
et-1.5.26 pyrr-0.10.3 requests-2.28.1 rich-12.5.1 scipy-1.9.0 screeninfo-0.8 ski
a-pathops-0.7.2 srt-3.5.2 tqdm-4.64.0 urllib3-1.26.11 watchdog-2.1.9 
You need to install the ffmepg software and add this to the environment path.
The default source code for create a circle is this:
from manim import *

# a simple python class
class DefaultClassExample(Scene):
    def construct(self):
        # add a circle 
        circle = Circle()
        # create a animation 
        self.play(Create(circle))
Use this command to create a video with this source code
manim -pql manim_001.py test
Manim Community v0.16.0.post0
...
INFO     Previewed File at: 'C:\Python310\media\videos\manim_001\480p15\DefaultClassExample.mp4'
...
This is the result of this command:

Blender 3D and python scripting - part 024.

In this tutorial I will show you how to use GeometryNodes with python script and Blender A.P.I.
You can see the result in the next image.
The Object Info node gets information from objects. This can be useful to control parameters in the geometry node tree with an external object, either directly by using its geometry, or via its transformation properties. An Object Info node can be added quickly by dragging an object into the node editor.
Another information can be found on the manual link.
In the next script you can see I created a simple BezierCurve object.
The definition named new_GeometryNodes_group is used to create two nodes GroupInit and GroupOutput.
I commente the source code to see some steps.
# import python packages
import bpy
from mathutils import Vector

# create a simpple BezierCurve and rename it with 'BezierCurveGeormetryNode'
bpy.ops.curve.primitive_bezier_curve_add()
bpy.ops.object.modifier_add(type='NODES')  

curve = bpy.context.active_object
curve.name = 'BezierCurveGeormetryNode'

# define a function for GroupInit and GroupOutput
def new_GeometryNodes_group():
    ''' Create a new empty node group that can be used
        in a GeometryNodes modifier.
    '''
    node_group = bpy.data.node_groups.new('GeometryNodes', 'GeometryNodeTree')
    inNode = node_group.nodes.new('NodeGroupInput')
    inNode.outputs.new('NodeSocketGeometry', 'Geometry')
    outNode = node_group.nodes.new('NodeGroupOutput')
    outNode.inputs.new('NodeSocketGeometry', 'Geometry')
    node_group.links.new(inNode.outputs['Geometry'], outNode.inputs['Geometry'])
    # the -3.5 is value for how far will be set the GroupInit and GroupOutput in the area of GeormetryNodes
    inNode.location = Vector((-3.5*inNode.width, 0))
    outNode.location = Vector((3.5*outNode.width, 0))
    return node_group

# the default curve modifier has no node group set, you need to set :
if curve.modifiers[-1].node_group:
    node_group = curve.modifiers[-1].node_group    
else:
    node_group = new_GeometryNodes_group()
    curve.modifiers[-1].node_group = node_group

# set default grup node as nodes
nodes = node_group.nodes

# get both nodes for each one 
group_in = nodes.get('Group Input')
group_out = nodes.get('Group Output')

# add the GeometryNodeObjectInfo to the GeometryNode area 
new_node_obj = nodes.new('GeometryNodeObjectInfo')
new_node_obj.inputs[0].default_value = bpy.data.objects["BezierCurveGeormetryNode"]