CodeSkulptor uses Skulpt to provide a browser-based coding environment and can be tested on the official website.
You can see an online default example with simplegui python package on that website with online editor.

pip3 install --upgrade --force-reinstall PyQt6
...
ERROR: Could not install packages due to an OSError: [WinError 2] The system cannot find the file specified:
...pylupdate6.exe
...pylupdate6.exe.deleteme'pip3 install --upgrade --force-reinstall PyQt6
Collecting PyQt6
...
Successfully installed PyQt6-6.4.1 PyQt6-Qt6-6.4.2 PyQt6-sip-13.4.1pip install --force-reinstall --no-cache-dir>>> import PyQt6
>>> from PyQt6.QtCore import QUrl
Traceback (most recent call last):
...
ImportError: DLL load failed while importing QtCore: The specified module could not be found.pip3 install PyQt6 --user --ignore-installed
Collecting PyQt6
...
Installing collected packages: PyQt6-Qt6, PyQt6-sip, PyQt6
WARNING: The scripts pylupdate6.exe and pyuic6.exe are installed in
...
which is not on PATH.
Consider adding this directory to PATH or, if you prefer to suppress this warning, use --no-warn-script-location.
Successfully installed PyQt6-6.4.0 PyQt6-Qt6-6.4.2 PyQt6-sip-13.4.0
>>> from PyQt6 import *
>>> dir(PyQt6)
['__builtins__', '__cached__', '__doc__', '__file__', '__loader__', '__name__', '__package__', '__path__', '__spec__']>>> import PyQt6
>>> from PyQt6 import QtCore
>>> dir(PyQt6)
['QtCore', '__builtins__', '__cached__', '__doc__', '__file__', '__loader__', '__name__', '__package__', '__path__', '__spec__', 'sip']
>>> from PyQt6.QtCore import QUrlpip3 install openai --userimport os
import openai
openai.api_key = "your_API_OpenAI_key"
response = openai.Completion.create(
model="text-davinci-003",
prompt="What is the python programmin language?",
temperature=0.7,
max_tokens=100,
top_p=1,
frequency_penalty=0,
presence_penalty=0
)
print(response)python openai001.py
{
"choices": [
{
"finish_reason": "stop",
"index": 0,
"logprobs": null,
"text": "\n\nPython is a high-level, interpreted, general-purpose programming language.
It was created by Guido van Rossum and first released in 1991. Python has a wide variety of
uses and is a popular language for data science, web development, automation, and artificial
intelligence. It is also a popular language for scripting and general-purpose programming."
}
],
"created": 1674588982,
"id": "cmpl-6cJNeACMtayBlExV1GJpilde0KcBN",
"model": "text-davinci-003",
"object": "text_completion",
"usage": {
"completion_tokens": 71,
"prompt_tokens": 8,
"total_tokens": 79
}
}
py --version
Python 3.11.0py -0
-V:3.11 * Python 3.11 (64-bit)
-V:3.10 Python 3.10 (64-bit)
-V:3.9 Python 3.9 (64-bit)
-V:3.7 Python 3.7 (64-bit)>py -3.10
Python 3.10.7 (tags/v3.10.7:6cc6b13, Sep 5 2022, 14:08:36) [MSC v.1933 64 bit (AMD64)] on win32
Type "help", "copyright", "credits" or "license" for more information.
>>> exit()py -3.10 scripting001.pypython -m pip uninstall quaternionpython -m pip install --upgrade --no-deps --force-reinstall numpy-quaternionimport numpy as np
import quaternion
# define a quaternion with real part a and imaginary parts bi, cj, dk
a = 1
b = 2
c = 3
d = 4
q = np.quaternion(a, b, c, d)
# define a quaternion using euler angles
x = 1.0
y = 2.0
z = 3.0
q2 = quaternion.from_euler_angles(x, y, z)
# define a vector to rotate
v = [1, 0, 0]
# perform the rotation using quaternion multiplication
# quaternion multiplication is not commutative, the order matters
# because this line of source code will not work: rotated_v = q2 * v * q2.conj()
rotated_v = (q2 * quaternion.quaternion(0, *v)) * q2.conj()
print(rotated_v)quaternion(0, 0.103846565151668, 0.422918571742548, 0.900197629735517)import ephem
import matplotlib.pyplot as plt
# create an observer
obs = ephem.Observer()
# set the observer's location
obs.lat = '47.27' # latitude
obs.lon = '26.18' # longitude
obs.elevation = 307 # elevation (meters)
# set the date and time of the observation
obs.date = '2022/05/15 12:00:00' # date and time
# if you want you can use now() for real time data
# create the bodies
mercury = ephem.Mercury(obs)
venus = ephem.Venus(obs)
mars = ephem.Mars(obs)
jupiter = ephem.Jupiter(obs)
saturn = ephem.Saturn(obs)
uranus = ephem.Uranus(obs)
neptune = ephem.Neptune(obs)
pluto = ephem.Pluto(obs)
moon = ephem.Moon(obs)
# compute the position of each planet and the moon
mercury.compute(obs)
venus.compute(obs)
mars.compute(obs)
jupiter.compute(obs)
saturn.compute(obs)
uranus.compute(obs)
neptune.compute(obs)
pluto.compute(obs)
moon.compute(obs)
# extract ra and dec coordinates of each body
ra = [mercury.ra, venus.ra, mars.ra, jupiter.ra, saturn.ra, uranus.ra, neptune.ra, pluto.ra,moon.ra]
dec = [mercury.dec, venus.dec, mars.dec, jupiter.dec, saturn.dec, uranus.dec, neptune.dec, pluto.dec,moon.dec]
# convert ra,dec from radians to degrees
ra = [r*180/ephem.pi for r in ra]
dec = [d*180/ephem.pi for d in dec]
print(ra,dec)
# create a scatter plot of the positions
plt.scatter(ra, dec)
# add labels for each planet
plt.annotate('Mercury', (ra[0], dec[0]))
plt.annotate('Venus', (ra[1], dec[1]))
plt.annotate('Mars', (ra[2], dec[2]))
plt.annotate('Jupiter', (ra[3], dec[3]))
plt.annotate('Saturn', (ra[4], dec[4]))
plt.annotate('Uranus', (ra[5], dec[5]))
plt.annotate('Neptune', (ra[6], dec[6]))
plt.annotate('Pluto', (ra[7], dec[7]))
plt.annotate('Moon', (ra[8], dec[8]))
plt.xlabel("RA [degrees]")
plt.ylabel("Dec [degrees]")
# show the plot
plt.show()
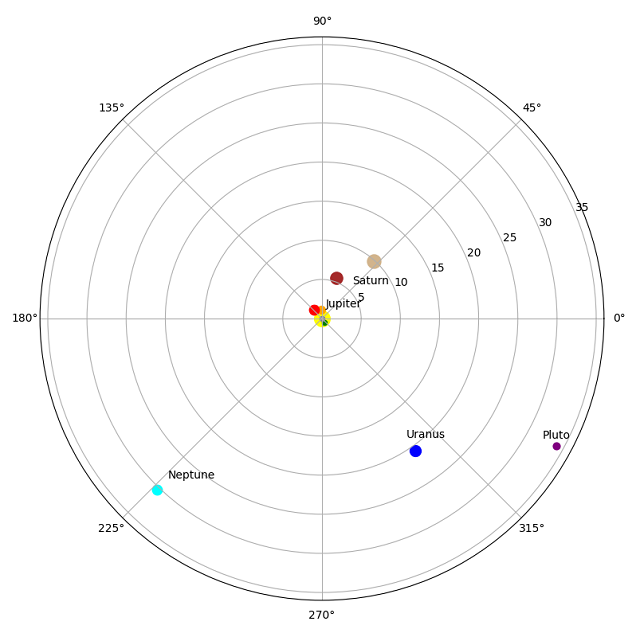
# Set the figure size
plt.figure(figsize=(10, 10))
# Define the polar axis
ax = plt.subplot(111, projection='polar')
# Set the axis limits
ax.set_ylim(0, 36)
# Plot the Sun at the center
plt.scatter(0, 0, s=200, color='yellow')
mercury_distance = mercury.earth_distance
venus_distance= venus.earth_distance
mars_distance= mars.earth_distance
jupiter_distance= jupiter.earth_distance
saturn_distance= saturn.earth_distance
uranus_distance= uranus.earth_distance
neptune_distance= neptune.earth_distance
pluto_distance= pluto.earth_distance
moon_distance= moon.earth_distance
print(mercury_distance)
distance = [mercury_distance,venus_distance,mars_distance,jupiter_distance,saturn_distance,uranus_distance,neptune_distance,pluto_distance,moon_distance]
# Plot the planets
plt.scatter(ra[0], distance[0], s=20, color='green')
plt.scatter(ra[1], distance[1], s=50, color='orange')
plt.scatter(ra[2], distance[2], s=80, color='red')
plt.scatter(ra[3], distance[3], s=120, color='brown')
plt.scatter(ra[4], distance[4], s=150, color='tan')
plt.scatter(ra[5], distance[5], s=100, color='blue')
plt.scatter(ra[6], distance[6], s=80, color='cyan')
plt.scatter(ra[7], distance[7], s=40, color='purple')
plt.scatter(ra[8], distance[8], s=20, color='gray')
# add the labels for each planet
plt.annotate('Mercury',(ra[0], distance[0]),xytext=(ra[0], distance[0] - 2))
plt.annotate('Venus',(ra[1], distance[1]),xytext=(ra[1], distance[1] - 2))
plt.annotate('Mars',(ra[2], distance[2]),xytext=(ra[2], distance[2] - 2))
plt.annotate('Jupiter',(ra[3], distance[3]),xytext=(ra[3], distance[3] - 4))
plt.annotate('Saturn',(ra[4], distance[4]),xytext=(ra[4], distance[4] - 4))
plt.annotate('Uranus',(ra[5], distance[5]),xytext=(ra[5], distance[5] - 2))
plt.annotate('Neptune',(ra[6], distance[6]),xytext=(ra[6], distance[6] - 2))
plt.annotate('Pluto',(ra[7], distance[7]),xytext=(ra[7], distance[7] - 2))
plt.annotate('Moon',(ra[8], distance[8]),xytext=(ra[8], distance[8] - 2))
# Show the plot
plt.show()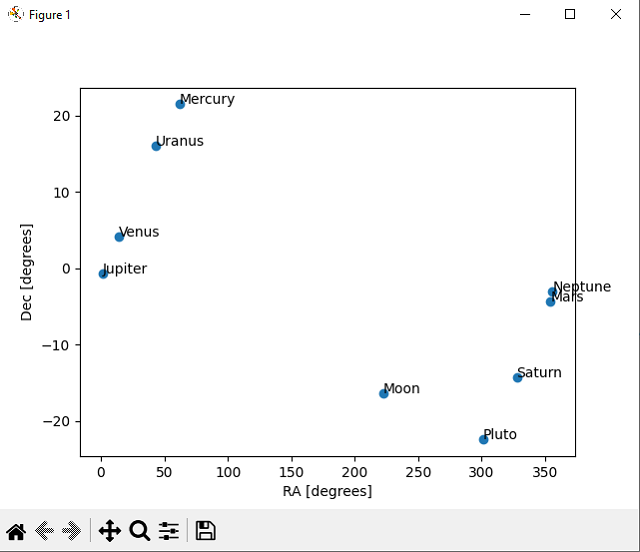
import ephem

# create an observer
obs = ephem.Observer()

# set the observer's location
obs.lat = '47.27' # latitude
obs.lon = '26.18' # longitude
obs.elevation = 307 # elevation (meters)

# set the date and time of the observation
obs.date = '2022/05/15 12:00:00' # date and time

# create the bodies
mercury = ephem.Mercury(obs)
venus = ephem.Venus(obs)
mars = ephem.Mars(obs)
jupiter = ephem.Jupiter(obs)
saturn = ephem.Saturn(obs)
uranus = ephem.Uranus(obs)
neptune = ephem.Neptune(obs)
pluto = ephem.Pluto(obs)
moon = ephem.Moon(obs)

# print the constellation
print("Mercury:", ephem.constellation(mercury))
print("Venus:", ephem.constellation(venus))
print("Mars:", ephem.constellation(mars))
print("Jupiter:", ephem.constellation(jupiter))
print("Saturn:", ephem.constellation(saturn))
print("Uranus:", ephem.constellation(uranus))
print("Neptune:", ephem.constellation(neptune))
print("Pluto:", ephem.constellation(pluto))
print("Moon:", ephem.constellation(moon))python constelation001.py
Mercury: ('Tau', 'Taurus')
Venus: ('Psc', 'Pisces')
Mars: ('Aqr', 'Aquarius')
Jupiter: ('Psc', 'Pisces')
Saturn: ('Cap', 'Capricornus')
Uranus: ('Ari', 'Aries')
Neptune: ('Psc', 'Pisces')
Pluto: ('Sgr', 'Sagittarius')
Moon: ('Lib', 'Libra')pip install pyephem --user
Requirement already satisfied: pyephem in
... site-packages (9.99)
Requirement already satisfied: ephem in
...
site-packages (from pyephem) (4.1.4)import ephem
# create a list with planets objects from ephem
planets = [ephem.Mercury(), ephem.Venus(), ephem.Mars(), ephem.Jupiter(), ephem.Saturn(), ephem.Uranus(), ephem.Neptune(), ephem.Moon()]
start_date = ephem.Date("2023/01/01")
end_date = ephem.Date("2023/12/31")
date = start_date
# create matrix to store planet names and conjunction dates
matrix = [[None for _ in range(len(planets) + 1)] for _ in range(len(planets))]
# create list to store planet names
planet_names = [planet.name for planet in planets]
# list all planets names as first row in matrix
matrix.insert(0, [""] + planet_names)
while date < end_date:
for i, planet1 in enumerate(planets):
for j, planet2 in enumerate(planets):
if i < j:
planet1.compute(date)
planet2.compute(date)
sep = ephem.separation(planet1, planet2) # calculate the angular distance
# compare the separation, if less than 0.01 degree then it's a conjunction
if sep < 1.0:
date_formatted = date.datetime().strftime("%d %B %Y")
matrix[i+1][j+1] = date_formatted
break
date = ephem.Date(date + 1)
# print a matrix with date is separation from 1 degree between planets on rows and column
for row in matrix:
print(row)['', 'Mercury', 'Venus', 'Mars', 'Jupiter', 'Saturn', 'Uranus', 'Neptune', 'Moon']
[None, None, '30 December 2023', '14 December 2023', '20 June 2023', None, None, None, None]
[None, None, None, '30 December 2023', '15 March 2023', '06 January 2023', None, None, '12 October 2023']
[None, None, None, None, None, None, '24 April 2023', None, '16 December 2023']
[None, None, None, None, None, '05 June 2023', '30 December 2023', None, None]
[None, None, None, None, None, None, None, '30 December 2023', None]
[None, None, None, None, None, None, None, '30 December 2023', None]
[None, None, None, None, None, None, None, None, '23 December 2023']
[None, None, None, None, None, None, None, None, None]pip install "sunpy[all] -U" import sunpy
print(sunpy.__version__)
3.1.8from matplotlib import pyplot as plt
import sunpy.map
import sunpy.data.sample
sunpyAIA = sunpy.map.Map(sunpy.data.sample.AIA_171_IMAGE)
sunpyAIA.plot()
plt.colorbar()
plt.show()
#!/usr/bin/env python3
import os
print(os.sys.path)
from scapy.all import *

def mysniff(interface):
    sniff(iface=interface, store=False, prn=process_sniffed_packet)

def process_sniffed_packet(packet):
    pyperclip.copy(str(packet))
    print(packet)

mysniff("Realtek PCIe GbE Family Controller")...
WARNING: WinPcap is now deprecated (not maintained). Please use Npcap instead
Ether / IP / TCP 104.244.42.2:https > 192.168.0.143:55478 PA / Raw
Ether / IP / TCP 192.168.0.143:55478 > 104.244.42.2:https PA / Raw
Ether / IP / TCP 192.168.0.143:55478 > 104.244.42.2:https PA / Raw
Ether / IP / TCP 104.244.42.2:https > 192.168.0.143:55478 A / Padding
Ether / IP / TCP 104.244.42.2:https > 192.168.0.143:55478 A / Padding
Ether / ARP who has 192.168.0.1 says 192.168.0.206 / Padding
...Python 3.10.2 (tags/v3.10.2:a58ebcc, Jan 17 2022, 14:12:15) [MSC v.1929 64 bit (AMD64)] on win32
...
pip show pyqt6
Name: PyQt6
Version: 6.4.0
Summary: Python bindings for the Qt cross platform application toolkitimport sys
from PyQt6.QtCore import Qt, QEvent, QPoint
from PyQt6.QtGui import QGuiApplication, QIcon, QAction
from PyQt6.QtWidgets import QApplication, QSystemTrayIcon, QMainWindow, QMenu
# create the default application
app = QApplication(sys.argv)
# create the main window
window = QMainWindow()
# set the title for the window
window.setWindowTitle("My Window")
# this set the tray icon and menu
tray_icon = QSystemTrayIcon()
tray_icon.setIcon(QIcon("icon.png"))
menu = QMenu()
# add an action to the menu to show the window
show_window_action = QAction("Show Window", None)
show_window_action.triggered.connect(window.show)
menu.addAction(show_window_action)
# add an action to the menu to exit the application
exit_action = QAction("Exit", None)
exit_action.triggered.connect(app.quit)
menu.addAction(exit_action)
# set the context menu
tray_icon.setContextMenu(menu)
# show the tray icon
tray_icon.show()
# run the application
app.exec()
from sentinelsat import SentinelAPI, read_geojson, geojson_to_wkt
from datetime import date
# Connect to the Sentinel API
api = SentinelAPI('___', '___', 'https://scihub.copernicus.eu/dhus')
#
api.download('___from_copernicus_website___')
# Search for Sentinel-2 images covering a specific area
footprint = geojson_to_wkt(read_geojson('area_of_interest.geojson'))

products = api.query(footprint,
                     date=('20211201', '20211205'),
                     platformname='Sentinel-1')
# convert to Pandas DataFrame
products_df = api.to_dataframe(products)
print(products_df)
# sort and limit to first 5 sorted products
products_df_sorted = products_df.sort_values(['link'], ascending=[True])
products_df_sorted = products_df_sorted.head(5)

# download sorted and reduced products
api.download_all(products_df_sorted.index)python test001.py
title ... productconsolidation
8f12995e-8f4b-4634-91bb-4971a1bdd0c3 S1B_IW_SLC__1SDV_20211201T160049_20211201T1601... ... NaN
c62ceac6-c9ac-409d-bea9-d1bc23b1b183 S1B_IW_GRDH_1SDV_20211201T160050_20211201T1601... ... NaN
2d1319c5-60af-468b-904a-5dfbdd5f205c S1B_IW_RAW__0SDV_20211201T160046_20211201T1601... ... SLICE
[3 rows x 36 columns]
Downloading S1B_IW_GRDH_1SDV_20211201T160050_20211201T160115_029834_038FB2_A390.zip: 100%|█| 929M/929M [02:44<00:00, 5.
Downloading products: 33%|██████████████████▋ | 1/3 [02:58<05:57, 178.58s/product]
Downloading S1B_IW_RAW__0SDV_20211201T160046_20211201T160119_029834_038FB2_D35D.zip: 83%|▊| 1.31G/1.58G [03:21<00:26,
Downloading S1B_IW_SLC__1SDV_20211201T160049_20211201T160116_029834_038FB2_AC13.zip: 31%|▎| 1.33G/4.35G [03:18<04:16,
...
pip install rembg
Collecting rembg
Downloading rembg-2.0.25-py3-none-any.whl (12 kB)from rembg import remove
from PIL import Image
input_path = 'input001.png'
output_path = 'output001.png'
input = Image.open(input_path)
output = remove(input)
output.save(output_path)python remove_background.py
Access denied with the following error:
Too many users have viewed or downloaded this file recently. Please
try accessing the file again later. If the file you are trying to
access is particularly large or is shared with many people, it may
take up to 24 hours to be able to view or download the file. If you
still can't access a file after 24 hours, contact your domain
administrator.
You may still be able to access the file from the browser:
https://drive.google.com/uc?id=1tCU5MM1LhRgGou5OpmpjBQbSrYIUoYab
...C:\Users\your_user\.u2net\
from web3 import Web3
node_provider = "https://mainnet.infura.io/v3/1f2fb5d1e1be4c11acdbbb07a2e06a1c"

web3_connection = Web3(Web3.HTTPProvider(node_provider))


def is_connected():
    print(web3_connection.isConnected())

def latest_block():
    print(web3_connection.eth.block_number)

def balanceETH(ETH_address):
    balance = web3_connection.eth.get_balance(ETH_address)
    balance_for_ETH = web3_connection.fromWei(balance,'ether')
print(balance_for_ETH)(web3_001) [mythcat@fedora PythonProjects]$ vi web3_func_001.py
(web3_001) [mythcat@fedora PythonProjects]$ python
Python 3.9.13 (main, Aug 25 2022, 23:26:10)
[GCC 11.2.0] :: Anaconda, Inc. on linux
Type "help", "copyright", "credits" or "license" for more information.
>>> from web3_func_001 import *
>>> is_connected()
True
>>> latest_block()
15516253
>>> balanceETH("0x74E55f28a8A0158b466FcB481EC7e6bE45D1DB91")
0
import bpy

#get active object - default
obj = bpy.context.active_object

# set the default start for working with Geometry Nodes modifier
# you need to have a Geometry Nodes modifier
node_group = obj.modifiers['GeometryNodes'].node_group
nodes = node_group.nodes

#get the node named 'Group Output'
geom_out = nodes.get('Group Output')

#create a string node
string_node = nodes.new('FunctionNodeInputString')
# set the name to 'String'
string_out = string_node.outputs['String']
# set the value to "This is a string"
string_node.string = "This is a string"

# link to the Group Output
node_group.links.new(string_out, geom_out.inputs[-1])python.exe -m pip install manim
...
Successfully installed Pillow-9.2.0 Pygments-2.12.0 certifi-2022.6.15 charset-no
rmalizer-2.1.0 click-8.1.3 click-default-group-1.2.2 cloup-0.13.1 colour-0.1.5 c
ommonmark-0.9.1 decorator-5.1.1 glcontext-2.3.6 idna-3.3 isosurfaces-0.1.0 manim
-0.16.0.post0 manimpango-0.4.1 mapbox-earcut-0.12.11 moderngl-5.6.4 moderngl-win
dow-2.4.1 multipledispatch-0.6.0 networkx-2.8.5 pycairo-1.21.0 pydub-0.25.1 pygl
et-1.5.26 pyrr-0.10.3 requests-2.28.1 rich-12.5.1 scipy-1.9.0 screeninfo-0.8 ski
a-pathops-0.7.2 srt-3.5.2 tqdm-4.64.0 urllib3-1.26.11 watchdog-2.1.9 from manim import *
# a simple python class
class DefaultClassExample(Scene):
def construct(self):
# add a circle
circle = Circle()
# create a animation
self.play(Create(circle))manim -pql manim_001.py test
Manim Community v0.16.0.post0
...
INFO Previewed File at: 'C:\Python310\media\videos\manim_001\480p15\DefaultClassExample.mp4'
...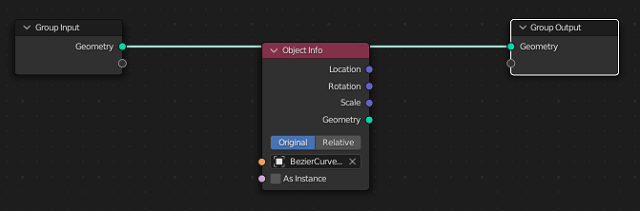
# import python packages
import bpy
from mathutils import Vector

# create a simpple BezierCurve and rename it with 'BezierCurveGeormetryNode'
bpy.ops.curve.primitive_bezier_curve_add()
bpy.ops.object.modifier_add(type='NODES')

curve = bpy.context.active_object
curve.name = 'BezierCurveGeormetryNode'

# define a function for GroupInit and GroupOutput
def new_GeometryNodes_group():
    ''' Create a new empty node group that can be used
        in a GeometryNodes modifier.
    '''
    node_group = bpy.data.node_groups.new('GeometryNodes', 'GeometryNodeTree')
    inNode = node_group.nodes.new('NodeGroupInput')
    inNode.outputs.new('NodeSocketGeometry', 'Geometry')
    outNode = node_group.nodes.new('NodeGroupOutput')
    outNode.inputs.new('NodeSocketGeometry', 'Geometry')
    node_group.links.new(inNode.outputs['Geometry'], outNode.inputs['Geometry'])
    # the -3.5 is value for how far will be set the GroupInit and GroupOutput in the area of GeormetryNodes
    inNode.location = Vector((-3.5*inNode.width, 0))
    outNode.location = Vector((3.5*outNode.width, 0))
    return node_group

# the default curve modifier has no node group set, you need to set :
if curve.modifiers[-1].node_group:
    node_group = curve.modifiers[-1].node_group
else:
    node_group = new_GeometryNodes_group()
    curve.modifiers[-1].node_group = node_group

# set default grup node as nodes
nodes = node_group.nodes

# get both nodes for each one
group_in = nodes.get('Group Input')
group_out = nodes.get('Group Output')

# add the GeometryNodeObjectInfo to the GeometryNode area
new_node_obj = nodes.new('GeometryNodeObjectInfo')
new_node_obj.inputs[0].default_value = bpy.data.objects["BezierCurveGeormetryNode"]